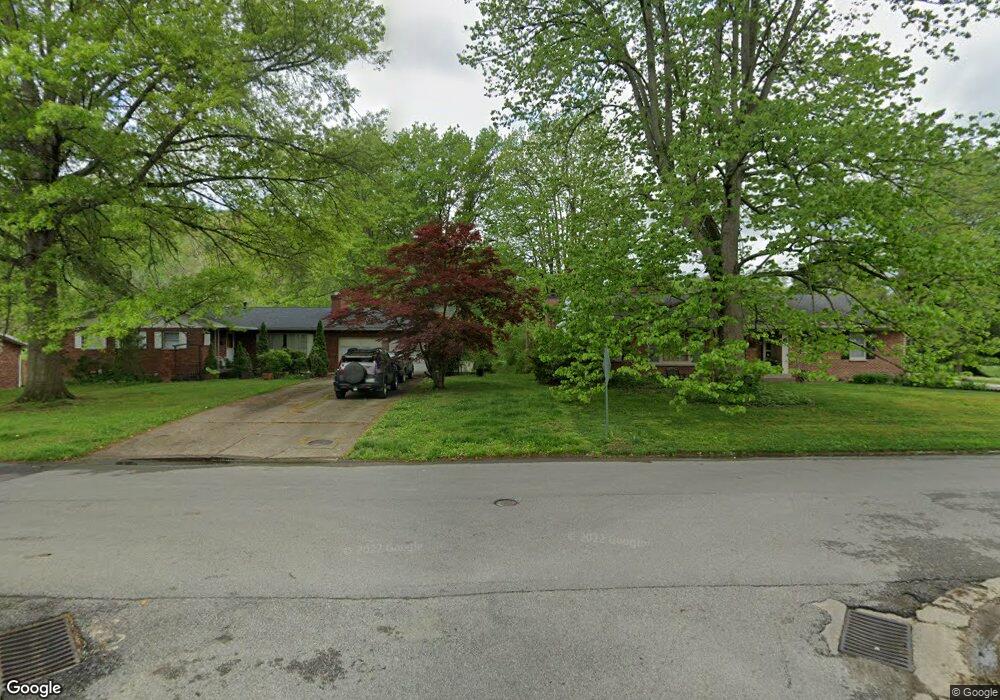
30 9th Ave Saint Albans, WV 25177
Estimated Value: $107,000 - $128,000
3
Beds
1
Bath
960
Sq Ft
$125/Sq Ft
Est. Value
About This Home
This home is located at 30 9th Ave, Saint Albans, WV 25177 and is currently estimated at $120,333, approximately $125 per square foot. 30 9th Ave is a home with nearby schools including Twin City Christian Academy.
Ownership History
Date
Name
Owned For
Owner Type
Purchase Details
Closed on
Mar 30, 2015
Sold by
Lemon James R
Bought by
Patton Tera E
Current Estimated Value
Home Financials for this Owner
Home Financials are based on the most recent Mortgage that was taken out on this home.
Original Mortgage
$8,000
Outstanding Balance
$2,791
Interest Rate
3.77%
Mortgage Type
New Conventional
Estimated Equity
$117,542
Purchase Details
Closed on
Apr 7, 2011
Sold by
Williams Terry L
Bought by
Lemon James R
Home Financials for this Owner
Home Financials are based on the most recent Mortgage that was taken out on this home.
Original Mortgage
$63,352
Interest Rate
5.5%
Mortgage Type
FHA
Create a Home Valuation Report for This Property
The Home Valuation Report is an in-depth analysis detailing your home's value as well as a comparison with similar homes in the area
Home Values in the Area
Average Home Value in this Area
Purchase History
| Date | Buyer | Sale Price | Title Company |
|---|---|---|---|
| Patton Tera E | $70,000 | None Available | |
| Lemon James R | $65,000 | -- |
Source: Public Records
Mortgage History
| Date | Status | Borrower | Loan Amount |
|---|---|---|---|
| Open | Patton Tera E | $8,000 | |
| Previous Owner | Lemon James R | $63,352 |
Source: Public Records
Tax History
| Year | Tax Paid | Tax Assessment Tax Assessment Total Assessment is a certain percentage of the fair market value that is determined by local assessors to be the total taxable value of land and additions on the property. | Land | Improvement |
|---|---|---|---|---|
| 2025 | $820 | $51,720 | $4,320 | $47,400 |
| 2024 | $820 | $48,000 | $4,320 | $43,680 |
| 2023 | $696 | $45,900 | $4,320 | $41,580 |
| 2022 | $767 | $50,100 | $9,240 | $40,860 |
| 2021 | $653 | $42,420 | $9,240 | $33,180 |
| 2020 | $640 | $41,580 | $9,240 | $32,340 |
| 2019 | $655 | $42,060 | $9,240 | $32,820 |
| 2018 | $645 | $41,700 | $9,240 | $32,460 |
| 2017 | $625 | $40,320 | $8,340 | $31,980 |
| 2016 | $625 | $40,260 | $8,340 | $31,920 |
| 2015 | $448 | $32,220 | $5,640 | $26,580 |
| 2014 | $448 | $28,920 | $5,640 | $23,280 |
Source: Public Records
Map
Nearby Homes
Your Personal Tour Guide
Ask me questions while you tour the home.