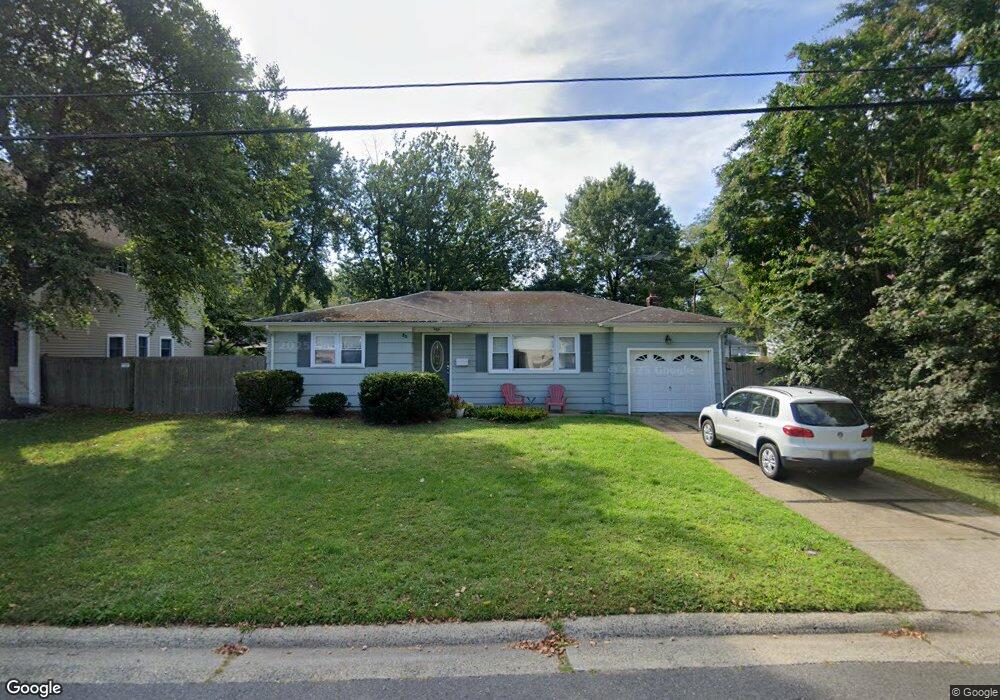
30 Bradley Ave Oceanport, NJ 07757
Estimated Value: $665,000 - $756,000
3
Beds
2
Baths
1,460
Sq Ft
$491/Sq Ft
Est. Value
About This Home
This home is located at 30 Bradley Ave, Oceanport, NJ 07757 and is currently estimated at $717,175, approximately $491 per square foot. 30 Bradley Ave is a home located in Monmouth County with nearby schools including Wolf Hill Elementary School, Maple Place Elementary and Middle School, and Shore Regional High School.
Ownership History
Date
Name
Owned For
Owner Type
Purchase Details
Closed on
Nov 22, 1996
Sold by
Duda Anna
Bought by
Bry Linda
Current Estimated Value
Home Financials for this Owner
Home Financials are based on the most recent Mortgage that was taken out on this home.
Original Mortgage
$103,000
Outstanding Balance
$9,900
Interest Rate
7.81%
Estimated Equity
$707,275
Create a Home Valuation Report for This Property
The Home Valuation Report is an in-depth analysis detailing your home's value as well as a comparison with similar homes in the area
Home Values in the Area
Average Home Value in this Area
Purchase History
| Date | Buyer | Sale Price | Title Company |
|---|---|---|---|
| Bry Linda | $163,000 | -- |
Source: Public Records
Mortgage History
| Date | Status | Borrower | Loan Amount |
|---|---|---|---|
| Open | Bry Linda | $103,000 |
Source: Public Records
Tax History Compared to Growth
Tax History
| Year | Tax Paid | Tax Assessment Tax Assessment Total Assessment is a certain percentage of the fair market value that is determined by local assessors to be the total taxable value of land and additions on the property. | Land | Improvement |
|---|---|---|---|---|
| 2025 | $7,391 | $559,200 | $417,500 | $141,700 |
| 2024 | $7,510 | $468,100 | $332,500 | $135,600 |
| 2023 | $7,510 | $451,300 | $322,500 | $128,800 |
| 2022 | $7,256 | $397,000 | $272,500 | $124,500 |
| 2021 | $7,256 | $380,900 | $262,500 | $118,400 |
| 2020 | $6,652 | $363,900 | $247,500 | $116,400 |
| 2019 | $6,390 | $354,800 | $242,500 | $112,300 |
| 2018 | $6,324 | $353,500 | $242,500 | $111,000 |
| 2017 | $5,442 | $252,300 | $145,500 | $106,800 |
| 2016 | $5,407 | $252,300 | $147,500 | $104,800 |
| 2015 | $5,177 | $249,600 | $147,500 | $102,100 |
| 2014 | $5,483 | $268,100 | $177,500 | $90,600 |
Source: Public Records
Map
Nearby Homes
- 10 Asbury Ave
- 265 Port Au Peck Ave
- 3 Foggia Way
- 66 Shrewsbury Ave
- 13 Morris Place
- 14 Oceanport Ave
- 94 Paddock Ct
- 15 Signal Ave
- 238 Branchport Ave
- 572 Jay St
- 8 Pocahontas Ave
- 222 Coleman Ave
- 565 Joline Ave
- 11 Clay St
- 631 Irving Place
- 3 Sandbar Aly
- 190 Spruce St Unit 4
- 401 Joline Ave
- 119 Washington St
- 7 Linden Ave