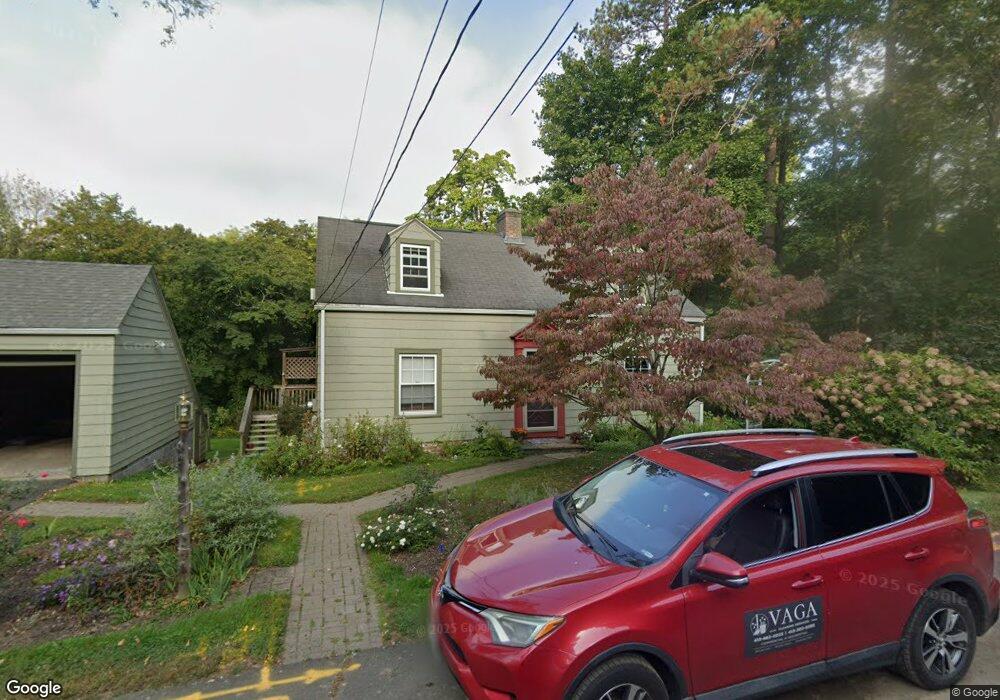
30 Brock Way South Hadley, MA 01075
Estimated Value: $460,000 - $519,000
3
Beds
2
Baths
1,404
Sq Ft
$344/Sq Ft
Est. Value
About This Home
This home is located at 30 Brock Way, South Hadley, MA 01075 and is currently estimated at $482,631, approximately $343 per square foot. 30 Brock Way is a home located in Hampshire County with nearby schools including Plains Elementary School, Mosier Elementary School, and Michael E. Smith Middle School.
Ownership History
Date
Name
Owned For
Owner Type
Purchase Details
Closed on
Sep 30, 2015
Sold by
Balkin Richard A and Swados Felice
Bought by
Swados Felice
Current Estimated Value
Purchase Details
Closed on
Aug 4, 2009
Sold by
Stevens Thomas B and Stevens Maura
Bought by
Balkin Richard A and Swados Felice
Home Financials for this Owner
Home Financials are based on the most recent Mortgage that was taken out on this home.
Original Mortgage
$216,000
Interest Rate
5.43%
Mortgage Type
Purchase Money Mortgage
Purchase Details
Closed on
Jun 6, 1997
Sold by
Brown Lois S
Bought by
Stevens Maura and Stevens Thomas B
Home Financials for this Owner
Home Financials are based on the most recent Mortgage that was taken out on this home.
Original Mortgage
$104,000
Interest Rate
7.98%
Mortgage Type
Purchase Money Mortgage
Create a Home Valuation Report for This Property
The Home Valuation Report is an in-depth analysis detailing your home's value as well as a comparison with similar homes in the area
Home Values in the Area
Average Home Value in this Area
Purchase History
| Date | Buyer | Sale Price | Title Company |
|---|---|---|---|
| Swados Felice | -- | -- | |
| Balkin Richard A | $271,000 | -- | |
| Stevens Maura | $130,000 | -- |
Source: Public Records
Mortgage History
| Date | Status | Borrower | Loan Amount |
|---|---|---|---|
| Previous Owner | Balkin Richard A | $216,000 | |
| Previous Owner | Stevens Maura | $5,050 | |
| Previous Owner | Stevens Maura | $26,000 | |
| Previous Owner | Stevens Maura | $108,120 | |
| Previous Owner | Stevens Maura | $104,000 |
Source: Public Records
Tax History Compared to Growth
Tax History
| Year | Tax Paid | Tax Assessment Tax Assessment Total Assessment is a certain percentage of the fair market value that is determined by local assessors to be the total taxable value of land and additions on the property. | Land | Improvement |
|---|---|---|---|---|
| 2025 | $6,722 | $414,700 | $149,600 | $265,100 |
| 2024 | $6,419 | $386,900 | $139,900 | $247,000 |
| 2023 | $6,140 | $345,500 | $126,900 | $218,600 |
| 2022 | $5,984 | $315,300 | $126,900 | $188,400 |
| 2021 | $5,839 | $294,900 | $118,700 | $176,200 |
| 2020 | $5,059 | $248,700 | $118,700 | $130,000 |
| 2019 | $4,930 | $239,900 | $113,200 | $126,700 |
| 2018 | $4,762 | $233,200 | $109,800 | $123,400 |
| 2017 | $4,640 | $224,600 | $109,800 | $114,800 |
Source: Public Records
Map
Nearby Homes
- 97 College St Unit A
- 96 College St
- 108 College St
- 15 Stanton Ave
- 19 Hadley St Unit E14
- 17 Woodbridge St
- 45 Pine St
- 101 Alvord Place
- 505 Alvord Place
- 25 Woodbridge St
- 11 Sycamore Knolls
- 134 Ferry St
- 88 Alvord St
- 19 Hildreth Ave
- 31 College View Heights
- 4 Sunrise Cir
- 85 Fairview St
- 75 Silver St
- Lot 6 Cold Hill
- 67 Amherst Rd Unit 67