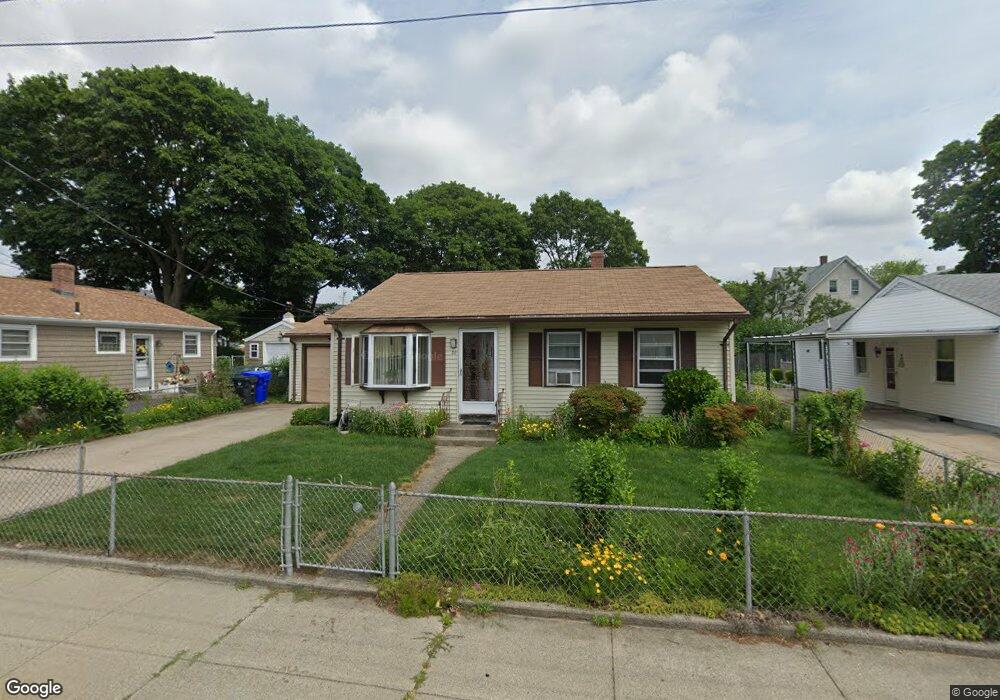
30 Bucklin St Pawtucket, RI 02861
Darlington NeighborhoodEstimated Value: $306,351 - $394,000
2
Beds
1
Bath
926
Sq Ft
$375/Sq Ft
Est. Value
About This Home
This home is located at 30 Bucklin St, Pawtucket, RI 02861 and is currently estimated at $346,838, approximately $374 per square foot. 30 Bucklin St is a home located in Providence County with nearby schools including St Cecilia School and Saint Raphael Academy.
Ownership History
Date
Name
Owned For
Owner Type
Purchase Details
Closed on
Apr 28, 2025
Sold by
Titus Scott J and Titus Page M
Bought by
Titus Scott J and Lesperance Melanie M
Current Estimated Value
Purchase Details
Closed on
Jun 9, 2022
Sold by
Titus Scott J
Bought by
Titus Scott J and Titus Paige M
Purchase Details
Closed on
Feb 4, 2021
Sold by
Degnan Lucyna S
Bought by
Degnan Lucyna S and Titus Scott J
Create a Home Valuation Report for This Property
The Home Valuation Report is an in-depth analysis detailing your home's value as well as a comparison with similar homes in the area
Home Values in the Area
Average Home Value in this Area
Purchase History
| Date | Buyer | Sale Price | Title Company |
|---|---|---|---|
| Titus Scott J | -- | None Available | |
| Titus Scott J | -- | None Available | |
| Titus Scott J | -- | None Available | |
| Titus Scott J | -- | None Available | |
| Degnan Lucyna S | -- | None Available | |
| Degnan Lucyna S | -- | None Available | |
| Degnan Lucyna S | $138,875 | None Available | |
| Degnan Lucyna S | $138,875 | None Available |
Source: Public Records
Tax History
| Year | Tax Paid | Tax Assessment Tax Assessment Total Assessment is a certain percentage of the fair market value that is determined by local assessors to be the total taxable value of land and additions on the property. | Land | Improvement |
|---|---|---|---|---|
| 2025 | $3,712 | $282,300 | $125,700 | $156,600 |
| 2024 | $3,484 | $282,300 | $125,700 | $156,600 |
| 2023 | $3,493 | $206,200 | $78,600 | $127,600 |
| 2022 | $3,419 | $206,200 | $78,600 | $127,600 |
| 2021 | $3,419 | $206,200 | $78,600 | $127,600 |
| 2020 | $3,230 | $154,600 | $62,100 | $92,500 |
| 2019 | $3,230 | $154,600 | $62,100 | $92,500 |
| 2018 | $3,112 | $154,600 | $62,100 | $92,500 |
| 2017 | $3,042 | $133,900 | $51,400 | $82,500 |
| 2016 | $2,931 | $133,900 | $51,400 | $82,500 |
| 2015 | $2,931 | $133,900 | $51,400 | $82,500 |
| 2014 | $2,509 | $108,800 | $51,400 | $57,400 |
Source: Public Records
Map
Nearby Homes
Your Personal Tour Guide
Ask me questions while you tour the home.