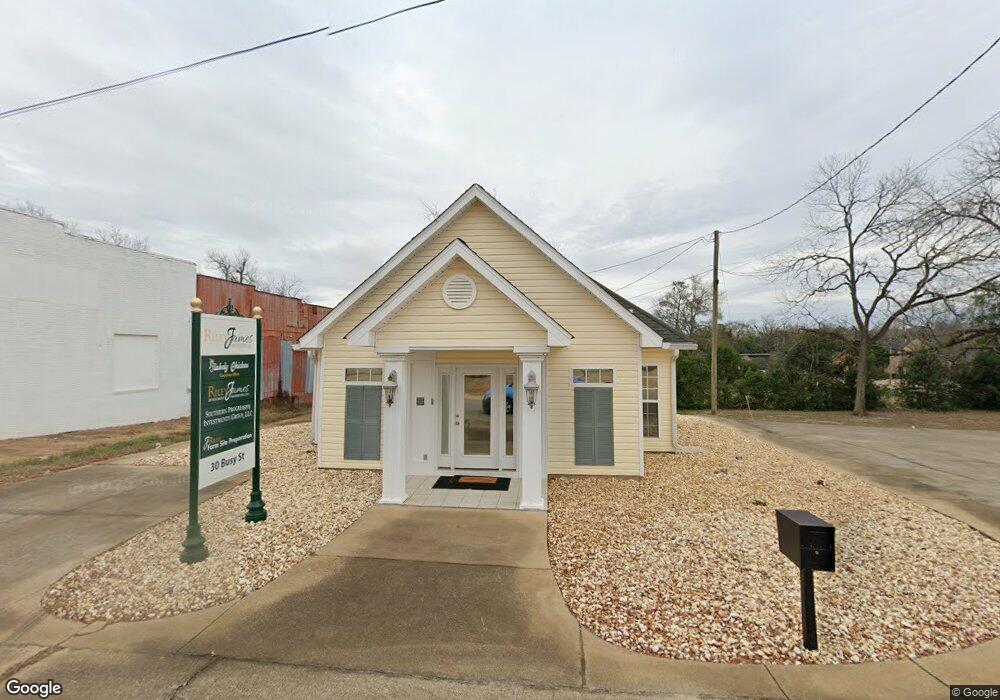
30 Busy St Blakely, GA 39823
--
Bed
--
Bath
955
Sq Ft
0.5
Acres
About This Home
This home is located at 30 Busy St, Blakely, GA 39823. 30 Busy St is a home located in Early County with nearby schools including Early County Elementary School, Early County Middle School, and Early County High School.
Ownership History
Date
Name
Owned For
Owner Type
Purchase Details
Closed on
Jan 18, 2022
Sold by
Pataula Land & Title Co Llc
Bought by
Riley James Investment Properties L
Home Financials for this Owner
Home Financials are based on the most recent Mortgage that was taken out on this home.
Original Mortgage
$125,334
Outstanding Balance
$35,561
Interest Rate
3.45%
Mortgage Type
Mortgage Modification
Purchase Details
Closed on
Sep 15, 2021
Sold by
Anchor Ii Llc
Bought by
Pataula Land & Title Co Llc
Purchase Details
Closed on
Mar 27, 2007
Sold by
Pataula Land & Title Co Ll
Bought by
Anchor Ii Llc
Purchase Details
Closed on
Feb 15, 2002
Sold by
Strong Betty E
Bought by
Pataula Land & Title
Purchase Details
Closed on
May 31, 2000
Sold by
Underwood W F
Bought by
Strong Betty E
Purchase Details
Closed on
Apr 6, 2000
Sold by
Underwood William F Jr Trustee
Bought by
Underwood John Edgar Etal
Purchase Details
Closed on
Dec 31, 1981
Bought by
Underwood W F
Create a Home Valuation Report for This Property
The Home Valuation Report is an in-depth analysis detailing your home's value as well as a comparison with similar homes in the area
Home Values in the Area
Average Home Value in this Area
Purchase History
| Date | Buyer | Sale Price | Title Company |
|---|---|---|---|
| Riley James Investment Properties L | $122,500 | -- | |
| Pataula Land & Title Co Llc | -- | -- | |
| Anchor Ii Llc | $45,000 | -- | |
| Pataula Land & Title | $36,500 | -- | |
| Strong Betty E | $10,500 | -- | |
| Underwood John Edgar Etal | -- | -- | |
| Underwood W F | -- | -- |
Source: Public Records
Mortgage History
| Date | Status | Borrower | Loan Amount |
|---|---|---|---|
| Open | Riley James Investment Properties L | $125,334 |
Source: Public Records
Tax History Compared to Growth
Tax History
| Year | Tax Paid | Tax Assessment Tax Assessment Total Assessment is a certain percentage of the fair market value that is determined by local assessors to be the total taxable value of land and additions on the property. | Land | Improvement |
|---|---|---|---|---|
| 2024 | $1,446 | $46,806 | $14,944 | $31,862 |
| 2023 | $1,388 | $46,806 | $14,944 | $31,862 |
| 2022 | $1,180 | $46,806 | $14,944 | $31,862 |
| 2021 | $1,192 | $46,806 | $14,944 | $31,862 |
| 2020 | $1,170 | $46,806 | $14,944 | $31,862 |
| 2019 | $1,200 | $46,648 | $14,944 | $31,704 |
| 2018 | $1,398 | $46,648 | $14,944 | $31,704 |
| 2017 | $1,399 | $46,648 | $14,944 | $31,704 |
| 2016 | $1,050 | $35,132 | $14,944 | $20,188 |
| 2015 | -- | $34,455 | $14,944 | $19,512 |
| 2014 | -- | $34,456 | $14,944 | $19,512 |
| 2013 | -- | $34,680 | $14,943 | $19,737 |
Source: Public Records
Map
Nearby Homes
- 76 S Jefferson Ave
- 73 W Westward Ave
- 337 College St
- 234 College St
- 600 Chattahoochee Ave
- 73 Grove Place
- 74 S Lancelot St
- Stein Rd
- 000 Georgia 62
- 21 E Railroad Ln
- 556 Flowers Dr
- 18802 E South Blvd
- 8 Lots Unknown Ln
- 0000 Martin Luther King Junior Blvd
- 1827 Tarver Dr
- 115 S Central Ave
- 182 S Central Ave
- 16 Woodlawn Dr
- 00 N Woodlawn Dr
- 507 Lakewood Dr