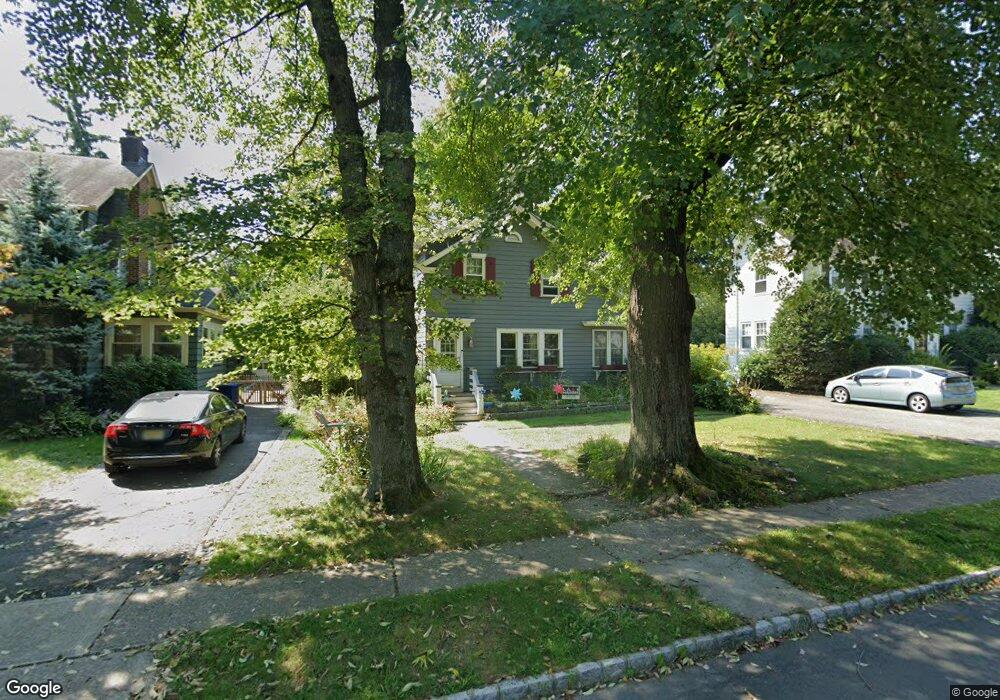
30 Carolin Rd Montclair, NJ 07043
Estimated Value: $1,002,697 - $1,308,000
Studio
--
Bath
1,216
Sq Ft
$959/Sq Ft
Est. Value
About This Home
This home is located at 30 Carolin Rd, Montclair, NJ 07043 and is currently estimated at $1,165,924, approximately $958 per square foot. 30 Carolin Rd is a home located in Essex County with nearby schools including Bradford School, Hillside School, and Nishuane School.
Ownership History
Date
Name
Owned For
Owner Type
Purchase Details
Closed on
Oct 1, 1998
Sold by
Teas Robert
Bought by
Lawrence Neil and Lawrence Lisa
Current Estimated Value
Home Financials for this Owner
Home Financials are based on the most recent Mortgage that was taken out on this home.
Original Mortgage
$207,000
Outstanding Balance
$45,282
Interest Rate
6.89%
Estimated Equity
$1,120,642
Purchase Details
Closed on
Nov 30, 1995
Sold by
Tomaszewski William
Bought by
Teas Robert and Teas Kerry
Home Financials for this Owner
Home Financials are based on the most recent Mortgage that was taken out on this home.
Original Mortgage
$197,000
Interest Rate
7.34%
Create a Home Valuation Report for This Property
The Home Valuation Report is an in-depth analysis detailing your home's value as well as a comparison with similar homes in the area
Home Values in the Area
Average Home Value in this Area
Purchase History
| Date | Buyer | Sale Price | Title Company |
|---|---|---|---|
| Lawrence Neil | $230,000 | -- | |
| Teas Robert | $207,000 | -- |
Source: Public Records
Mortgage History
| Date | Status | Borrower | Loan Amount |
|---|---|---|---|
| Open | Lawrence Neil | $207,000 | |
| Previous Owner | Teas Robert | $197,000 |
Source: Public Records
Tax History Compared to Growth
Tax History
| Year | Tax Paid | Tax Assessment Tax Assessment Total Assessment is a certain percentage of the fair market value that is determined by local assessors to be the total taxable value of land and additions on the property. | Land | Improvement |
|---|---|---|---|---|
| 2025 | $19,736 | $583,900 | $367,500 | $216,400 |
| 2024 | $19,736 | $583,900 | $367,500 | $216,400 |
| 2022 | $19,199 | $583,900 | $367,500 | $216,400 |
| 2021 | $18,866 | $583,900 | $367,500 | $216,400 |
| 2020 | $18,562 | $583,900 | $367,500 | $216,400 |
| 2019 | $18,369 | $583,900 | $367,500 | $216,400 |
| 2018 | $18,066 | $583,900 | $367,500 | $216,400 |
| 2017 | $16,549 | $443,200 | $329,100 | $114,100 |
| 2016 | $16,106 | $443,200 | $329,100 | $114,100 |
| 2015 | $15,627 | $443,200 | $329,100 | $114,100 |
| 2014 | $15,104 | $443,200 | $329,100 | $114,100 |
Source: Public Records
Map
Nearby Homes
- 386 Park St
- 15 Poe Ave
- 82 Watchung Ave Unit 84
- 92 Mountain Ave
- 58 Yantecaw Ave
- 32 Dodd St
- 9 Wells Ct
- 163 Park St
- 215 Upper Mountain Ave
- 112 Heller Way
- 8350 Blvd E Unit 3A
- 41 Glenridge Ave Unit 2L
- 41 Glenridge Ave Unit 2R
- 42 Meadow Ln
- 15 Carol Place
- 1552 Broad St Rear
- 44 George St
- 63 Montclair Ave
- 197 N Fullerton Ave
- 24 Club Way