30 Chapman St Greenfield, MA 01301
--
Bed
1
Bath
680
Sq Ft
871
Sq Ft Lot
About This Home
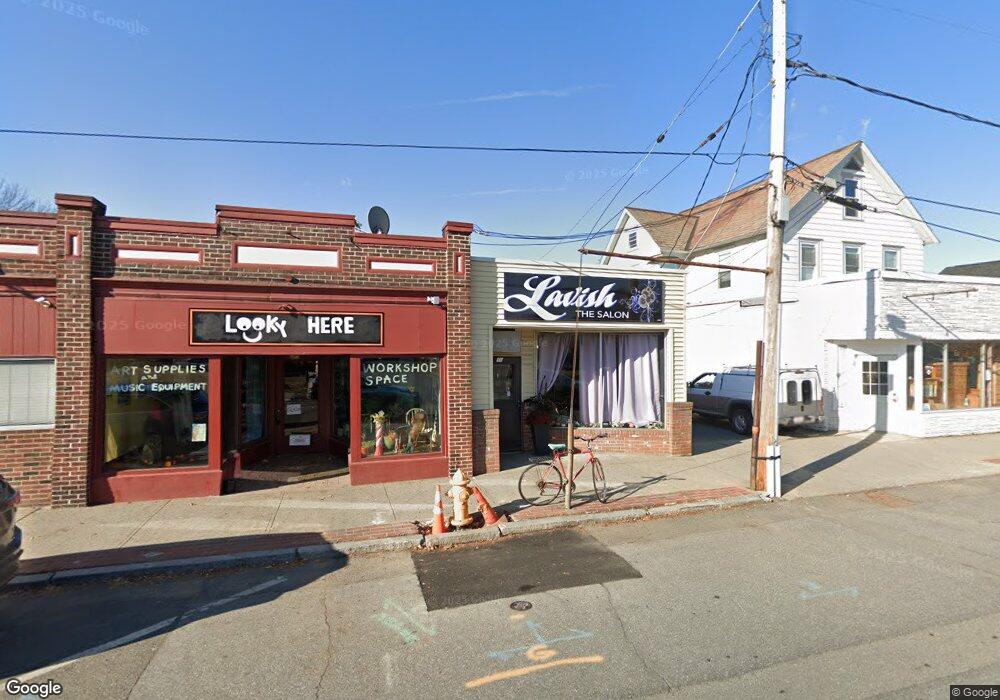
This home is located at 30 Chapman St, Greenfield, MA 01301. 30 Chapman St is a home located in Franklin County.
Ownership History
Date
Name
Owned For
Owner Type
Purchase Details
Closed on
Jun 27, 2016
Sold by
Kostanski Richard and Kostanski Amy-Jo
Bought by
Smith Daniel K and Smith Michelle S
Home Financials for this Owner
Home Financials are based on the most recent Mortgage that was taken out on this home.
Original Mortgage
$200,000
Outstanding Balance
$159,609
Interest Rate
3.57%
Mortgage Type
Commercial
Purchase Details
Closed on
Dec 9, 1999
Sold by
Suchanek Beverly A and Melnik Beverly A
Bought by
Kostanski Richard and Kostanski Amyjo
Home Financials for this Owner
Home Financials are based on the most recent Mortgage that was taken out on this home.
Original Mortgage
$23,000
Interest Rate
7.9%
Mortgage Type
Commercial
Create a Home Valuation Report for This Property
The Home Valuation Report is an in-depth analysis detailing your home's value as well as a comparison with similar homes in the area
Home Values in the Area
Average Home Value in this Area
Purchase History
| Date | Buyer | Sale Price | Title Company |
|---|---|---|---|
| Smith Daniel K | $68,000 | -- | |
| Smith Daniel K | $68,000 | -- | |
| Kostanski Richard | $40,000 | -- | |
| Kostanski Richard | $40,000 | -- |
Source: Public Records
Mortgage History
| Date | Status | Borrower | Loan Amount |
|---|---|---|---|
| Open | Smith Daniel K | $200,000 | |
| Closed | Smith Daniel K | $200,000 | |
| Previous Owner | Kostanski Richard | $23,000 |
Source: Public Records
Tax History Compared to Growth
Tax History
| Year | Tax Paid | Tax Assessment Tax Assessment Total Assessment is a certain percentage of the fair market value that is determined by local assessors to be the total taxable value of land and additions on the property. | Land | Improvement |
|---|---|---|---|---|
| 2025 | $1,545 | $79,000 | $27,600 | $51,400 |
| 2024 | $1,584 | $77,700 | $26,300 | $51,400 |
| 2023 | $1,403 | $71,400 | $23,900 | $47,500 |
| 2022 | $1,538 | $68,900 | $22,800 | $46,100 |
| 2021 | $1,591 | $68,500 | $22,400 | $46,100 |
| 2020 | $1,484 | $64,700 | $22,400 | $42,300 |
| 2019 | $1,447 | $64,700 | $22,400 | $42,300 |
| 2018 | $1,200 | $53,500 | $17,500 | $36,000 |
| 2017 | $1,163 | $53,500 | $17,500 | $36,000 |
| 2016 | $1,108 | $50,800 | $17,500 | $33,300 |
| 2015 | $1,166 | $51,800 | $17,500 | $34,300 |
| 2014 | $1,066 | $51,900 | $17,500 | $34,400 |
Source: Public Records
Map
Nearby Homes