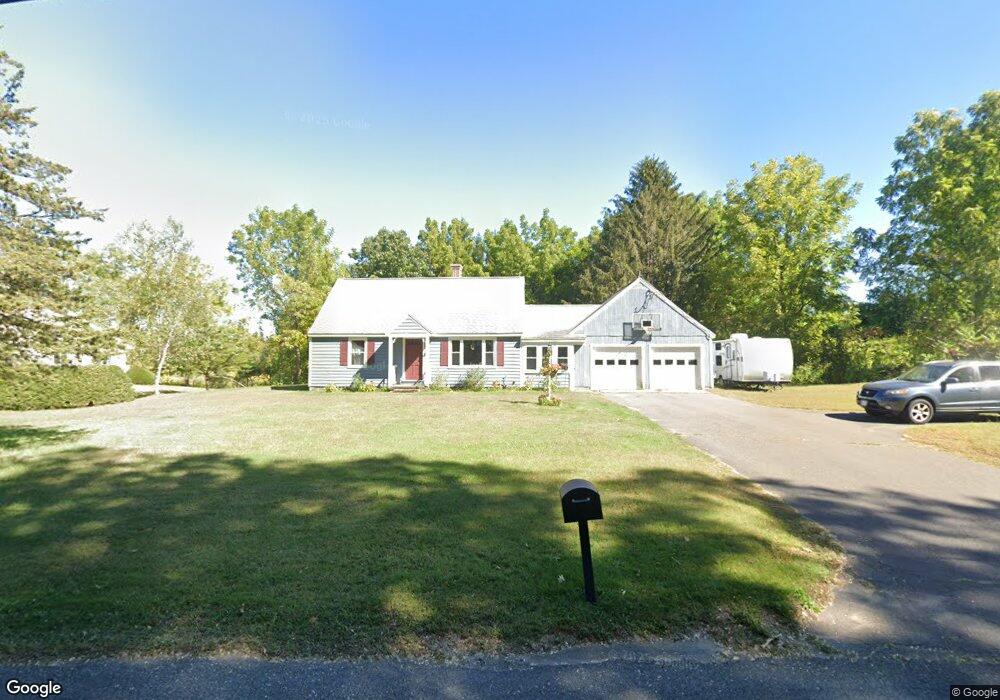
30 Chmura Rd Hadley, MA 01035
Estimated Value: $424,000 - $482,000
3
Beds
1
Bath
1,102
Sq Ft
$415/Sq Ft
Est. Value
About This Home
This home is located at 30 Chmura Rd, Hadley, MA 01035 and is currently estimated at $457,105, approximately $414 per square foot. 30 Chmura Rd is a home located in Hampshire County with nearby schools including Hadley Elementary School and The Hartsbrook School.
Ownership History
Date
Name
Owned For
Owner Type
Purchase Details
Closed on
Jan 11, 2018
Sold by
Lariviere Kathleen
Bought by
Horgan William J and Horgan Karen B
Current Estimated Value
Home Financials for this Owner
Home Financials are based on the most recent Mortgage that was taken out on this home.
Original Mortgage
$245,610
Outstanding Balance
$207,053
Interest Rate
3.9%
Mortgage Type
New Conventional
Estimated Equity
$250,052
Create a Home Valuation Report for This Property
The Home Valuation Report is an in-depth analysis detailing your home's value as well as a comparison with similar homes in the area
Home Values in the Area
Average Home Value in this Area
Purchase History
| Date | Buyer | Sale Price | Title Company |
|---|---|---|---|
| Horgan William J | $272,900 | -- |
Source: Public Records
Mortgage History
| Date | Status | Borrower | Loan Amount |
|---|---|---|---|
| Open | Horgan William J | $245,610 |
Source: Public Records
Tax History Compared to Growth
Tax History
| Year | Tax Paid | Tax Assessment Tax Assessment Total Assessment is a certain percentage of the fair market value that is determined by local assessors to be the total taxable value of land and additions on the property. | Land | Improvement |
|---|---|---|---|---|
| 2025 | $4,154 | $357,200 | $132,600 | $224,600 |
| 2024 | $3,947 | $346,500 | $132,600 | $213,900 |
| 2023 | $3,999 | $346,500 | $132,600 | $213,900 |
| 2022 | $3,759 | $308,600 | $132,600 | $176,000 |
| 2021 | $3,570 | $297,500 | $132,600 | $164,900 |
| 2020 | $3,539 | $276,900 | $132,600 | $144,300 |
| 2019 | $5,095 | $286,500 | $132,600 | $153,900 |
| 2018 | $64 | $274,900 | $132,600 | $142,300 |
| 2017 | $3,181 | $274,900 | $132,600 | $142,300 |
| 2016 | $3,065 | $274,900 | $132,600 | $142,300 |
| 2015 | $2,515 | $231,600 | $132,600 | $99,000 |
| 2014 | $2,464 | $231,600 | $132,600 | $99,000 |
Source: Public Records
Map
Nearby Homes
- 34 Hockanum Rd
- 150 East St
- 109 Bay Rd
- 2 Scott Ln
- 83 Bay Rd
- 19 Baldwin Ln
- 119 East St
- 13 Vista Terrace
- 79 Aqua Vitae Rd
- 113 Pearl St
- 125 Pearl St
- 150 Pearl St
- 2 Skinnerwoods Way Unit 2
- 71 Russell St
- 66 Longmeadow Dr
- 5 Greystone Ave
- 14 Granby Heights
- 17 Granby Heights
- 58 Granby Heights
- 12-r Jackielyn Cir