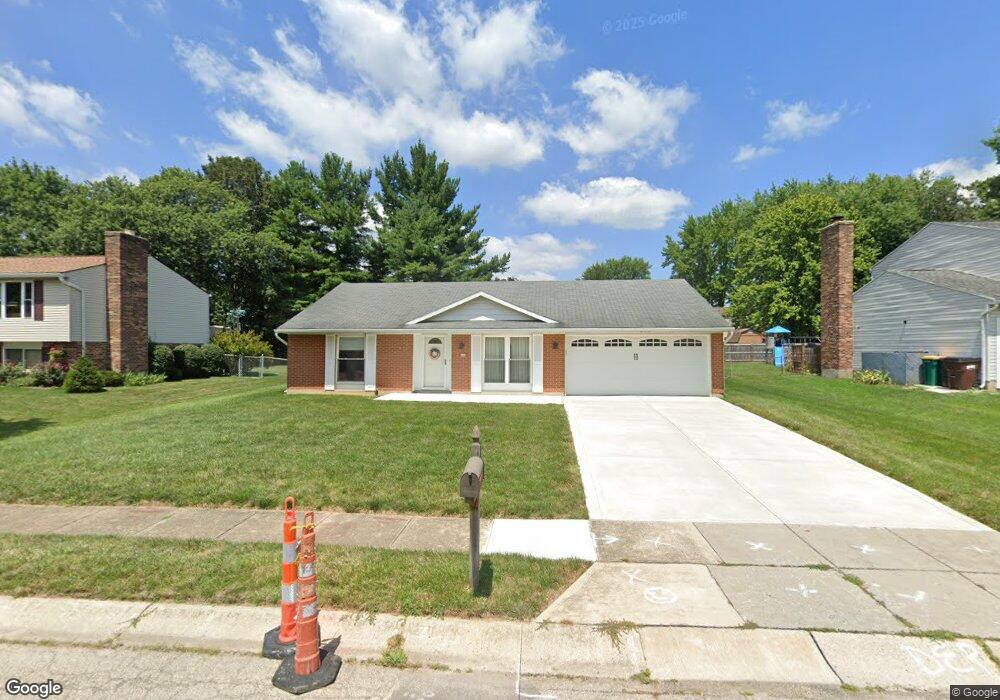
30 Creekview Ct Springboro, OH 45066
Estimated Value: $253,609 - $273,000
3
Beds
2
Baths
1,270
Sq Ft
$206/Sq Ft
Est. Value
About This Home
This home is located at 30 Creekview Ct, Springboro, OH 45066 and is currently estimated at $261,402, approximately $205 per square foot. 30 Creekview Ct is a home located in Warren County with nearby schools including Clearcreek Elementary School, Springboro Intermediate School, and Dennis Elementary School.
Ownership History
Date
Name
Owned For
Owner Type
Purchase Details
Closed on
Oct 15, 2020
Sold by
Manuel Jonathan H
Bought by
Montag Joseph P
Current Estimated Value
Home Financials for this Owner
Home Financials are based on the most recent Mortgage that was taken out on this home.
Original Mortgage
$134,320
Outstanding Balance
$118,385
Interest Rate
2.9%
Mortgage Type
New Conventional
Estimated Equity
$143,017
Purchase Details
Closed on
Jun 23, 2009
Sold by
Manuel Brenda S
Bought by
Manuel Jonathan H
Purchase Details
Closed on
Jun 2, 2004
Sold by
Manuel Jonathan H
Bought by
Manuel Brenda S
Purchase Details
Closed on
Aug 22, 1990
Sold by
Holderman Robert T and Holderman Robert T
Bought by
Manuel and Manuel Jonathan H
Purchase Details
Closed on
Jul 20, 1983
Sold by
Holderman Holderman and Holderman Karen O'Brien
Bought by
Holderman Holderman and Holderman Robert T
Purchase Details
Closed on
Jun 3, 1980
Sold by
Gibraltar Construction Co
Purchase Details
Closed on
May 5, 1978
Sold by
Tri Ohio Corp
Create a Home Valuation Report for This Property
The Home Valuation Report is an in-depth analysis detailing your home's value as well as a comparison with similar homes in the area
Home Values in the Area
Average Home Value in this Area
Purchase History
| Date | Buyer | Sale Price | Title Company |
|---|---|---|---|
| Montag Joseph P | $167,900 | None Available | |
| Manuel Jonathan H | -- | Attorney | |
| Manuel Brenda S | -- | Chicago Title Insurance Co | |
| Manuel | $83,500 | -- | |
| Holderman Holderman | -- | -- | |
| -- | $58,600 | -- | |
| -- | $18,500 | -- |
Source: Public Records
Mortgage History
| Date | Status | Borrower | Loan Amount |
|---|---|---|---|
| Open | Montag Joseph P | $134,320 |
Source: Public Records
Tax History
| Year | Tax Paid | Tax Assessment Tax Assessment Total Assessment is a certain percentage of the fair market value that is determined by local assessors to be the total taxable value of land and additions on the property. | Land | Improvement |
|---|---|---|---|---|
| 2025 | $2,070 | $62,810 | $17,500 | $45,310 |
| 2024 | $2,070 | $62,810 | $17,500 | $45,310 |
| 2023 | $2,171 | $50,984 | $10,762 | $40,222 |
| 2022 | $2,139 | $50,985 | $10,763 | $40,222 |
| 2021 | $1,991 | $50,985 | $10,763 | $40,222 |
| 2020 | $1,851 | $41,451 | $8,750 | $32,701 |
| 2019 | $1,707 | $41,451 | $8,750 | $32,701 |
| 2018 | $1,708 | $41,451 | $8,750 | $32,701 |
| 2017 | $1,735 | $37,930 | $8,134 | $29,796 |
| 2016 | $1,810 | $37,930 | $8,134 | $29,796 |
| 2015 | $1,859 | $37,930 | $8,134 | $29,796 |
| 2014 | $1,859 | $36,820 | $7,900 | $28,930 |
| 2013 | $1,858 | $40,800 | $8,750 | $32,050 |
Source: Public Records
Map
Nearby Homes
- 45 Wadestone St
- 90 Libby Hollow St
- 140 Dan Haven Place
- Calvin Plan at Wadestone - Designer Collection
- Charles Plan at Eastbrook Farms - Designer Collection
- Charles Plan at Wadestone - Designer Collection
- Huxley Plan at Wadestone - Masterpiece Collection
- Calvin Plan at Eastbrook Farms - Designer Collection
- Wyatt Plan at Wadestone - Designer Collection
- Winston Plan at Wadestone - Designer Collection
- Grandin Plan at Eastbrook Farms - Designer Collection
- Magnolia Plan at Eastbrook Farms - Designer Collection
- Avery Plan at Eastbrook Farms - Designer Collection
- Rhodes Plan at Wadestone - Masterpiece Collection
- Finley Plan at Wadestone - Masterpiece Collection
- Blair Plan at Wadestone - Designer Collection
- Emmett Plan at Eastbrook Farms - Designer Collection
- Winslow Plan at Wadestone - Masterpiece Collection
- Magnolia Plan at Wadestone - Designer Collection
- Beckett Plan at Wadestone - Masterpiece Collection
- 20 Creekview Ct
- 40 Creekview Ct
- 25 Twincreek Ct
- 35 Twincreek Ct
- 50 Creekview Ct
- 15 Twincreek Ct
- 10 Creekview Ct
- 790 W Market St
- 25 Creekview Ct
- 35 Creekview Ct
- 45 Twincreek Ct
- 780 W Market St
- 60 Creekview Ct
- 45 Creekview Ct
- 810 W Market St
- 55 Twincreek Ct
- 55 Creekview Ct
- 30 Twincreek Ct
- 2520 Factory Rd
- 40 Twincreek Ct