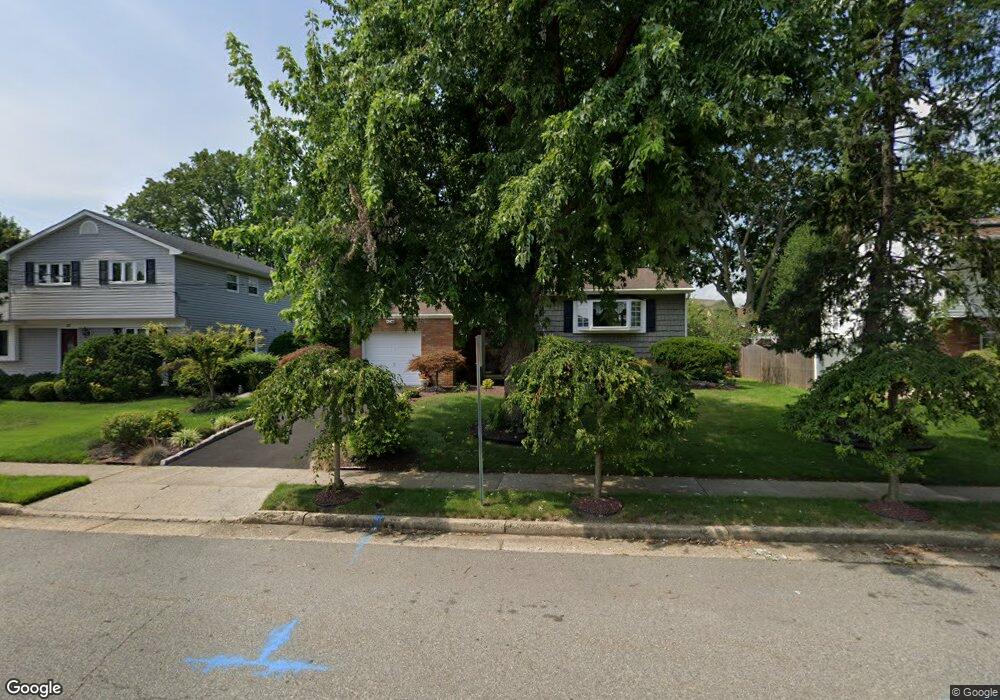
30 Cresci Blvd Hazlet, NJ 07730
Estimated Value: $595,000 - $730,000
4
Beds
3
Baths
1,540
Sq Ft
$420/Sq Ft
Est. Value
About This Home
This home is located at 30 Cresci Blvd, Hazlet, NJ 07730 and is currently estimated at $647,049, approximately $420 per square foot. 30 Cresci Blvd is a home located in Monmouth County with nearby schools including Raritan High School, St Benedict School, and St. Joseph Elementary School.
Ownership History
Date
Name
Owned For
Owner Type
Purchase Details
Closed on
Feb 23, 2022
Sold by
Hollenfer Stephanie E and Hollenfer Robert E
Bought by
Hollenfer Stephanie E and Hollenfer Robert E
Current Estimated Value
Home Financials for this Owner
Home Financials are based on the most recent Mortgage that was taken out on this home.
Original Mortgage
$358,312
Outstanding Balance
$334,178
Interest Rate
3.92%
Mortgage Type
New Conventional
Estimated Equity
$312,871
Create a Home Valuation Report for This Property
The Home Valuation Report is an in-depth analysis detailing your home's value as well as a comparison with similar homes in the area
Home Values in the Area
Average Home Value in this Area
Purchase History
| Date | Buyer | Sale Price | Title Company |
|---|---|---|---|
| Hollenfer Stephanie E | -- | Hale Leila H | |
| Hollenfer Stephanie E | -- | None Listed On Document |
Source: Public Records
Mortgage History
| Date | Status | Borrower | Loan Amount |
|---|---|---|---|
| Open | Hollenfer Stephanie E | $358,312 | |
| Closed | Hollenfer Stephanie E | $358,312 |
Source: Public Records
Tax History Compared to Growth
Tax History
| Year | Tax Paid | Tax Assessment Tax Assessment Total Assessment is a certain percentage of the fair market value that is determined by local assessors to be the total taxable value of land and additions on the property. | Land | Improvement |
|---|---|---|---|---|
| 2025 | $10,889 | $580,700 | $375,000 | $205,700 |
| 2024 | $10,535 | $517,800 | $313,000 | $204,800 |
| 2023 | $10,535 | $493,000 | $290,000 | $203,000 |
| 2022 | $8,974 | $403,700 | $225,000 | $178,700 |
| 2021 | $8,974 | $376,000 | $217,000 | $159,000 |
| 2020 | $9,460 | $366,400 | $211,000 | $155,400 |
| 2019 | $9,167 | $349,500 | $195,000 | $154,500 |
| 2018 | $8,974 | $339,300 | $192,000 | $147,300 |
| 2017 | $8,723 | $329,800 | $187,000 | $142,800 |
| 2016 | $8,595 | $326,200 | $187,000 | $139,200 |
| 2015 | $8,473 | $322,400 | $186,000 | $136,400 |
| 2014 | $8,129 | $290,100 | $160,000 | $130,100 |
Source: Public Records
Map
Nearby Homes