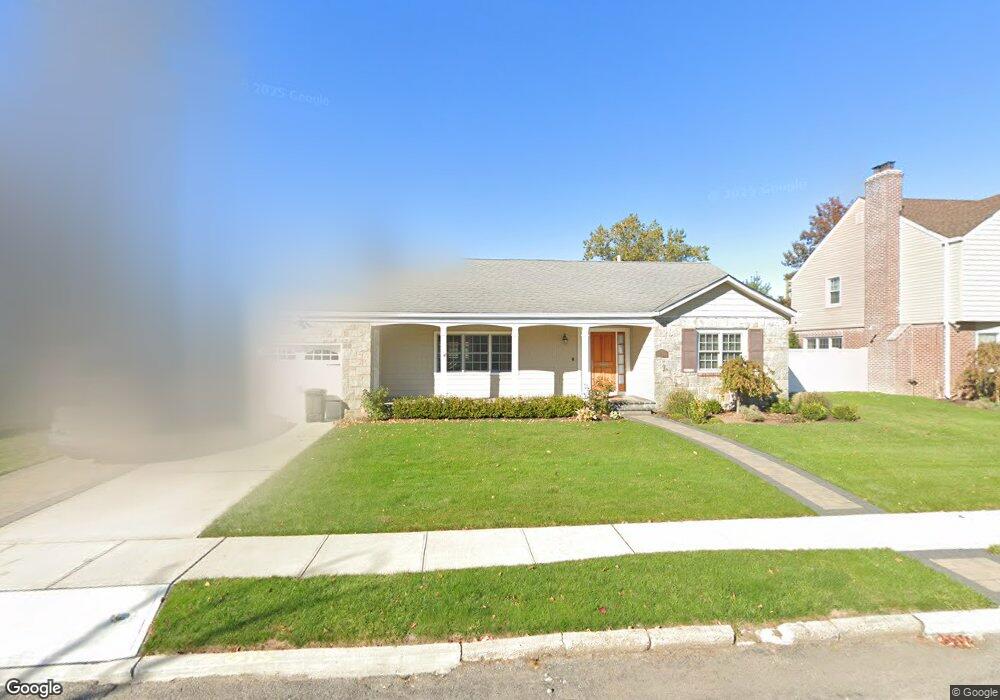
30 E Voss Ave East Rockaway, NY 11518
Estimated Value: $874,949 - $945,000
3
Beds
2
Baths
1,800
Sq Ft
$506/Sq Ft
Est. Value
About This Home
This home is located at 30 E Voss Ave, East Rockaway, NY 11518 and is currently estimated at $909,975, approximately $505 per square foot. 30 E Voss Ave is a home located in Nassau County with nearby schools including Lynbrook Senior High School and Reenas Bais Yaakov.
Ownership History
Date
Name
Owned For
Owner Type
Purchase Details
Closed on
Feb 10, 2021
Sold by
Loper Wayne
Bought by
Intrieri Carol
Current Estimated Value
Purchase Details
Closed on
Jul 5, 2018
Sold by
Comegna Christine M
Bought by
Loper Wayne
Home Financials for this Owner
Home Financials are based on the most recent Mortgage that was taken out on this home.
Original Mortgage
$361,000
Interest Rate
4.5%
Mortgage Type
New Conventional
Purchase Details
Closed on
Nov 26, 2003
Sold by
Spector Julius
Bought by
Comegna Christine
Purchase Details
Closed on
Nov 15, 1996
Create a Home Valuation Report for This Property
The Home Valuation Report is an in-depth analysis detailing your home's value as well as a comparison with similar homes in the area
Home Values in the Area
Average Home Value in this Area
Purchase History
| Date | Buyer | Sale Price | Title Company |
|---|---|---|---|
| Intrieri Carol | $729,000 | Westcor Land Title | |
| Loper Wayne | $380,000 | Westcor Land Title | |
| Comegna Christine | $437,000 | -- | |
| -- | -- | -- |
Source: Public Records
Mortgage History
| Date | Status | Borrower | Loan Amount |
|---|---|---|---|
| Previous Owner | Loper Wayne | $361,000 |
Source: Public Records
Tax History Compared to Growth
Tax History
| Year | Tax Paid | Tax Assessment Tax Assessment Total Assessment is a certain percentage of the fair market value that is determined by local assessors to be the total taxable value of land and additions on the property. | Land | Improvement |
|---|---|---|---|---|
| 2025 | $12,890 | $525 | $216 | $309 |
| 2024 | $2,185 | $583 | $240 | $343 |
| 2023 | $14,599 | $656 | $272 | $384 |
| 2022 | $14,599 | $681 | $282 | $399 |
| 2021 | $20,892 | $664 | $275 | $389 |
| 2020 | $11,893 | $725 | $587 | $138 |
| 2019 | $1,808 | $725 | $587 | $138 |
| 2018 | $9,254 | $725 | $0 | $0 |
| 2017 | $8,142 | $725 | $587 | $138 |
| 2016 | $9,797 | $725 | $471 | $254 |
| 2015 | $1,714 | $765 | $452 | $313 |
| 2014 | $1,714 | $765 | $452 | $313 |
| 2013 | $1,882 | $903 | $534 | $369 |
Source: Public Records
Map
Nearby Homes