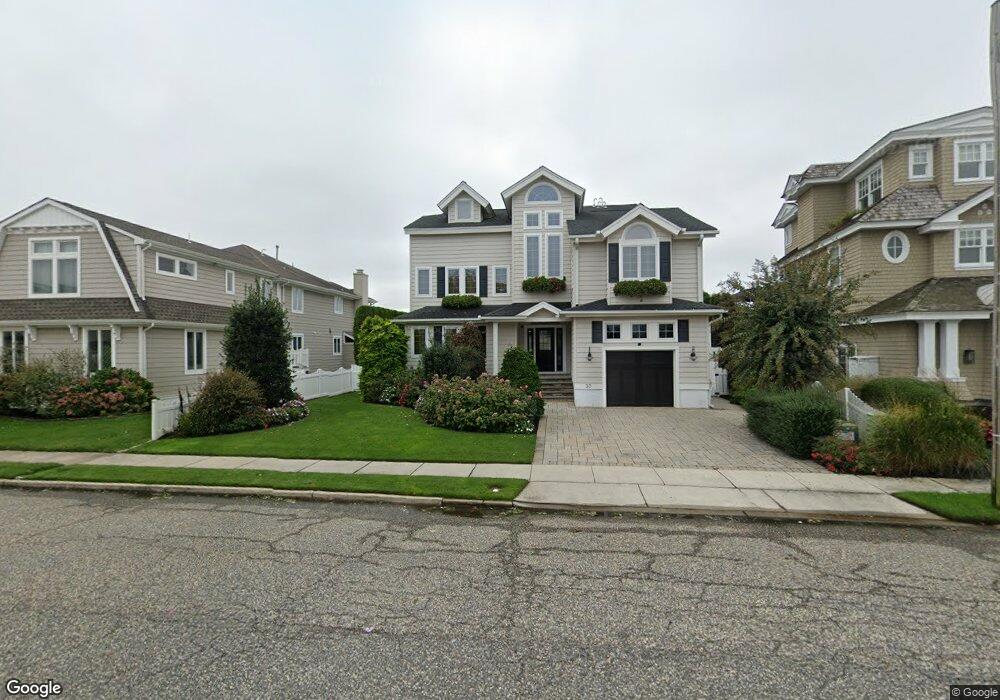
30 Flamingo Dr Avalon, NJ 08202
Estimated Value: $5,244,000 - $6,978,000
--
Bed
--
Bath
2,724
Sq Ft
$2,280/Sq Ft
Est. Value
About This Home
This home is located at 30 Flamingo Dr, Avalon, NJ 08202 and is currently estimated at $6,211,354, approximately $2,280 per square foot. 30 Flamingo Dr is a home with nearby schools including Avalon Elementary School.
Ownership History
Date
Name
Owned For
Owner Type
Purchase Details
Closed on
Oct 5, 2017
Sold by
Rudnay Tamas I and Rudnay Darcy M
Bought by
Rudnay Tamas I and Rudnay Darcy M
Current Estimated Value
Purchase Details
Closed on
Aug 6, 2012
Sold by
Weisgerber John and Weisgerber Mary Ann
Bought by
Rudnay Tamas I and Rudnay Darcy M
Home Financials for this Owner
Home Financials are based on the most recent Mortgage that was taken out on this home.
Original Mortgage
$1,000,000
Outstanding Balance
$692,753
Interest Rate
3.67%
Mortgage Type
New Conventional
Estimated Equity
$5,518,601
Purchase Details
Closed on
Feb 6, 1991
Sold by
New Jersey Dep
Bought by
Weisgerber John and Weisgerber Mary A
Create a Home Valuation Report for This Property
The Home Valuation Report is an in-depth analysis detailing your home's value as well as a comparison with similar homes in the area
Home Values in the Area
Average Home Value in this Area
Purchase History
| Date | Buyer | Sale Price | Title Company |
|---|---|---|---|
| Rudnay Tamas I | -- | None Available | |
| Rudnay Tamas I | $3,000,000 | None Available | |
| Weisgerber John | $15,700 | -- |
Source: Public Records
Mortgage History
| Date | Status | Borrower | Loan Amount |
|---|---|---|---|
| Open | Rudnay Tamas I | $1,000,000 |
Source: Public Records
Tax History Compared to Growth
Tax History
| Year | Tax Paid | Tax Assessment Tax Assessment Total Assessment is a certain percentage of the fair market value that is determined by local assessors to be the total taxable value of land and additions on the property. | Land | Improvement |
|---|---|---|---|---|
| 2025 | $19,603 | $3,192,600 | $2,508,000 | $684,600 |
| 2024 | $19,603 | $3,192,600 | $2,508,000 | $684,600 |
| 2023 | $19,443 | $3,192,600 | $2,508,000 | $684,600 |
| 2022 | $18,134 | $3,192,600 | $2,508,000 | $684,600 |
| 2021 | $16,282 | $3,192,600 | $2,508,000 | $684,600 |
| 2020 | $16,793 | $3,192,600 | $2,508,000 | $684,600 |
| 2019 | $16,282 | $3,192,600 | $2,508,000 | $684,600 |
| 2018 | $15,580 | $3,192,600 | $2,508,000 | $684,600 |
| 2017 | $14,158 | $2,546,400 | $1,915,000 | $631,400 |
| 2016 | $14,005 | $2,546,400 | $1,915,000 | $631,400 |
| 2015 | $13,776 | $2,546,400 | $1,915,000 | $631,400 |
| 2014 | $13,623 | $2,546,400 | $1,915,000 | $631,400 |
Source: Public Records
Map
Nearby Homes