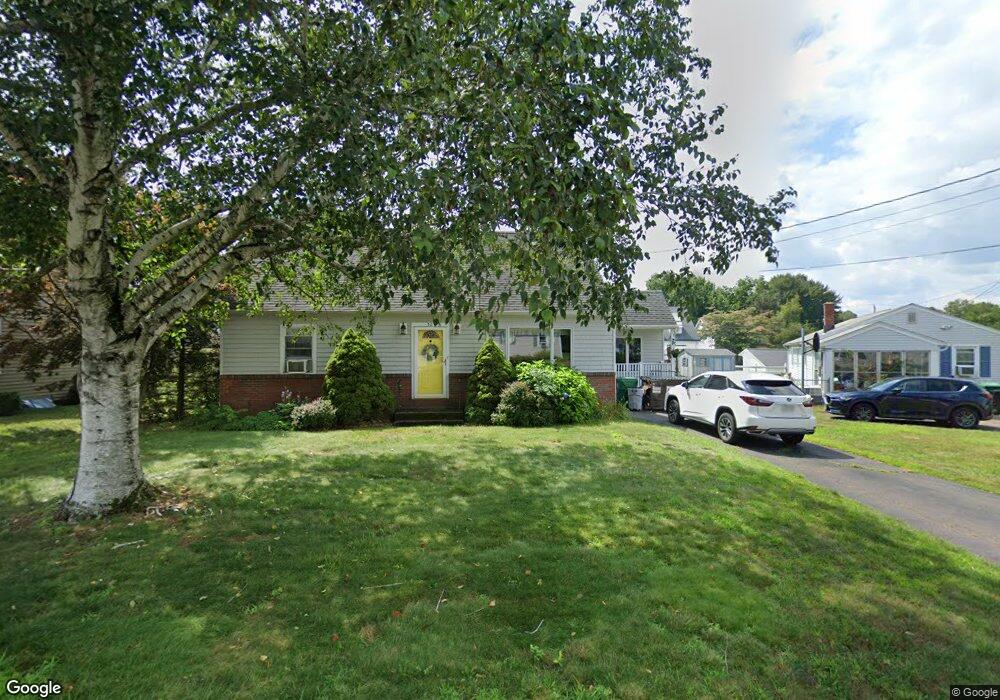
30 Francis St Chicopee, MA 01013
Chicopee Center NeighborhoodEstimated Value: $320,000 - $371,000
4
Beds
2
Baths
1,500
Sq Ft
$222/Sq Ft
Est. Value
About This Home
This home is located at 30 Francis St, Chicopee, MA 01013 and is currently estimated at $333,578, approximately $222 per square foot. 30 Francis St is a home located in Hampden County with nearby schools including Bowe Elementary School, Fairview Middle School, and Chicopee High School.
Ownership History
Date
Name
Owned For
Owner Type
Purchase Details
Closed on
Oct 25, 2004
Sold by
Galipeau Suzanne M
Bought by
Galipeau David and Galipeau Suzanne M
Current Estimated Value
Home Financials for this Owner
Home Financials are based on the most recent Mortgage that was taken out on this home.
Original Mortgage
$193,500
Outstanding Balance
$94,319
Interest Rate
5.85%
Mortgage Type
Purchase Money Mortgage
Estimated Equity
$239,259
Purchase Details
Closed on
Apr 30, 1999
Sold by
Laliberte Joseph P and Laliberte Barbara A
Bought by
Galipeau Suzanne M
Home Financials for this Owner
Home Financials are based on the most recent Mortgage that was taken out on this home.
Original Mortgage
$119,274
Interest Rate
6.95%
Mortgage Type
Purchase Money Mortgage
Purchase Details
Closed on
Jun 23, 1988
Sold by
Wood Edward A
Bought by
Laliberte Joseph P
Create a Home Valuation Report for This Property
The Home Valuation Report is an in-depth analysis detailing your home's value as well as a comparison with similar homes in the area
Home Values in the Area
Average Home Value in this Area
Purchase History
| Date | Buyer | Sale Price | Title Company |
|---|---|---|---|
| Galipeau David | -- | -- | |
| Galipeau Suzanne M | $123,000 | -- | |
| Laliberte Joseph P | $124,000 | -- |
Source: Public Records
Mortgage History
| Date | Status | Borrower | Loan Amount |
|---|---|---|---|
| Open | Laliberte Joseph P | $193,500 | |
| Previous Owner | Laliberte Joseph P | $52,670 | |
| Previous Owner | Laliberte Joseph P | $119,274 | |
| Previous Owner | Laliberte Joseph P | $59,000 |
Source: Public Records
Tax History
| Year | Tax Paid | Tax Assessment Tax Assessment Total Assessment is a certain percentage of the fair market value that is determined by local assessors to be the total taxable value of land and additions on the property. | Land | Improvement |
|---|---|---|---|---|
| 2025 | $3,831 | $252,700 | $83,700 | $169,000 |
| 2024 | $3,631 | $246,000 | $82,000 | $164,000 |
| 2023 | $3,403 | $224,600 | $74,600 | $150,000 |
| 2022 | $3,398 | $200,000 | $64,900 | $135,100 |
| 2021 | $3,210 | $182,300 | $59,000 | $123,300 |
| 2020 | $3,036 | $173,900 | $59,000 | $114,900 |
| 2019 | $2,981 | $166,000 | $59,000 | $107,000 |
| 2018 | $2,891 | $157,900 | $56,100 | $101,800 |
| 2017 | $2,818 | $162,800 | $56,100 | $106,700 |
| 2016 | $2,702 | $159,800 | $56,100 | $103,700 |
| 2015 | $2,813 | $160,400 | $56,100 | $104,300 |
| 2014 | $1,407 | $160,400 | $56,100 | $104,300 |
Source: Public Records
Map
Nearby Homes
Your Personal Tour Guide
Ask me questions while you tour the home.