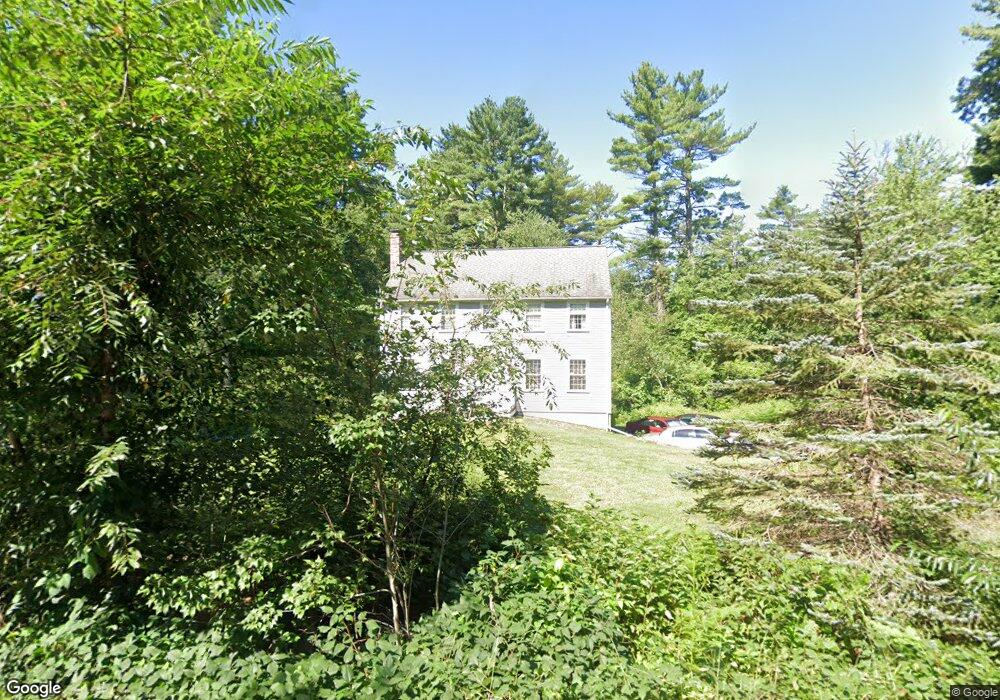
30 Granite St Medway, MA 02053
Estimated Value: $671,000 - $766,000
4
Beds
3
Baths
1,832
Sq Ft
$392/Sq Ft
Est. Value
About This Home
This home is located at 30 Granite St, Medway, MA 02053 and is currently estimated at $717,505, approximately $391 per square foot. 30 Granite St is a home located in Norfolk County with nearby schools including John D. McGovern Elementary School, Burke-Memorial Elementary, and Medway Middle School.
Ownership History
Date
Name
Owned For
Owner Type
Purchase Details
Closed on
Aug 17, 2001
Sold by
Park Henry W and Park Mathyl E
Bought by
Luca John A and Luca Laura M
Current Estimated Value
Home Financials for this Owner
Home Financials are based on the most recent Mortgage that was taken out on this home.
Original Mortgage
$210,000
Outstanding Balance
$81,977
Interest Rate
7.16%
Mortgage Type
Purchase Money Mortgage
Estimated Equity
$635,528
Create a Home Valuation Report for This Property
The Home Valuation Report is an in-depth analysis detailing your home's value as well as a comparison with similar homes in the area
Home Values in the Area
Average Home Value in this Area
Purchase History
| Date | Buyer | Sale Price | Title Company |
|---|---|---|---|
| Luca John A | $309,000 | -- |
Source: Public Records
Mortgage History
| Date | Status | Borrower | Loan Amount |
|---|---|---|---|
| Open | Luca John A | $210,000 |
Source: Public Records
Tax History
| Year | Tax Paid | Tax Assessment Tax Assessment Total Assessment is a certain percentage of the fair market value that is determined by local assessors to be the total taxable value of land and additions on the property. | Land | Improvement |
|---|---|---|---|---|
| 2025 | $8,423 | $591,100 | $339,900 | $251,200 |
| 2024 | $8,512 | $591,100 | $339,900 | $251,200 |
| 2023 | $8,450 | $530,100 | $309,400 | $220,700 |
| 2022 | $7,370 | $435,300 | $228,800 | $206,500 |
| 2021 | $7,311 | $418,700 | $213,500 | $205,200 |
| 2020 | $7,186 | $410,600 | $213,500 | $197,100 |
| 2019 | $6,764 | $398,600 | $204,800 | $193,800 |
| 2018 | $6,799 | $385,000 | $196,100 | $188,900 |
| 2017 | $6,765 | $377,500 | $191,800 | $185,700 |
| 2016 | $6,559 | $362,200 | $176,500 | $185,700 |
| 2015 | $6,506 | $356,700 | $174,300 | $182,400 |
| 2014 | $6,483 | $344,100 | $174,300 | $169,800 |
Source: Public Records
Map
Nearby Homes
- 22 Granite St
- 15 Fox Run Rd
- 462 Hartford Ave
- 8 Liberty Rd
- 42 Fisher St
- 56 Fisher St
- 28 Fisher St
- 21 Maple St
- 56 Puddingstone Ln
- 8 Apache Rd
- 394 Village St
- 44 Black Bear Cir Unit 44
- 46 Black Bear Cir Unit 46
- 48 Black Bear Cir Unit 48
- 21 Carp Rd
- 43 Black Bear Cir Unit 43
- 15 Black Bear Cir Unit 15
- 13 Black Bear Cir Unit 13
- 2 Kingson Ln Unit 2
- 11 Black Bear Unit 11
Your Personal Tour Guide
Ask me questions while you tour the home.