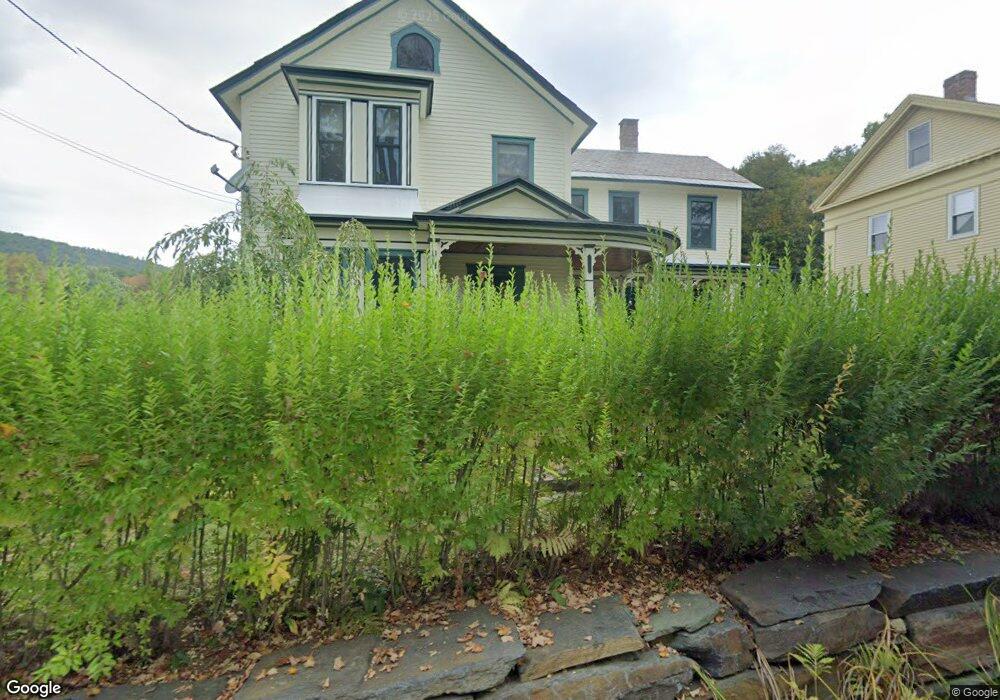
30 High St Charlemont, MA 01339
Estimated Value: $331,816 - $445,000
4
Beds
2
Baths
2,104
Sq Ft
$183/Sq Ft
Est. Value
About This Home
This home is located at 30 High St, Charlemont, MA 01339 and is currently estimated at $384,454, approximately $182 per square foot. 30 High St is a home located in Franklin County with nearby schools including Mohawk Trail Regional High School and The Academy At Charlemont.
Ownership History
Date
Name
Owned For
Owner Type
Purchase Details
Closed on
Apr 21, 2022
Sold by
Williams James R and Williams Susan L
Bought by
James R Williams Ret and Williams
Current Estimated Value
Purchase Details
Closed on
Sep 1, 1973
Bought by
Williams James R and Williams Susan
Create a Home Valuation Report for This Property
The Home Valuation Report is an in-depth analysis detailing your home's value as well as a comparison with similar homes in the area
Home Values in the Area
Average Home Value in this Area
Purchase History
| Date | Buyer | Sale Price | Title Company |
|---|---|---|---|
| James R Williams Ret | -- | None Available | |
| James R Williams Ret | -- | None Available | |
| Williams James R | -- | -- |
Source: Public Records
Mortgage History
| Date | Status | Borrower | Loan Amount |
|---|---|---|---|
| Previous Owner | Williams James R | $40,000 | |
| Previous Owner | Williams James R | $18,000 | |
| Previous Owner | Williams James R | $36,232 | |
| Previous Owner | Williams James R | $46,000 |
Source: Public Records
Tax History Compared to Growth
Tax History
| Year | Tax Paid | Tax Assessment Tax Assessment Total Assessment is a certain percentage of the fair market value that is determined by local assessors to be the total taxable value of land and additions on the property. | Land | Improvement |
|---|---|---|---|---|
| 2025 | $4,763 | $260,300 | $27,200 | $233,100 |
| 2024 | $5,038 | $243,400 | $24,700 | $218,700 |
| 2023 | $4,755 | $230,500 | $22,700 | $207,800 |
| 2022 | $4,714 | $227,400 | $22,700 | $204,700 |
| 2021 | $4,489 | $219,200 | $22,700 | $196,500 |
| 2020 | $3,773 | $193,400 | $22,700 | $170,700 |
| 2019 | $3,816 | $193,400 | $22,700 | $170,700 |
| 2018 | $3,982 | $195,000 | $22,700 | $172,300 |
| 2017 | $3,939 | $195,000 | $22,700 | $172,300 |
| 2016 | $3,579 | $182,600 | $22,700 | $159,900 |
| 2015 | $3,265 | $182,600 | $22,700 | $159,900 |
Source: Public Records
Map
Nearby Homes
- 174 Main St
- 0 Warfield Rd
- 0 E Hawley Rd Unit 73456358
- 2153 Massachusetts 2
- 766 Tea St
- 0 Maxwell Rd Unit 246884
- 49 East Rd
- 0 W Hawley Rd
- 63 W Hawley Rd
- 0, Lot 7 East Rd
- Lot 3.2 East Rd
- 0 Potters Rd Unit 73439831
- 559 Tea St
- 153 E Hawley Rd
- 143 Charlemont Rd
- 14 South Rd
- 0 W Oxbow Rd Unit 73453651
- 41 Buckland Rd
- 292 E Hawley Rd
- 24 W Oxbow Rd