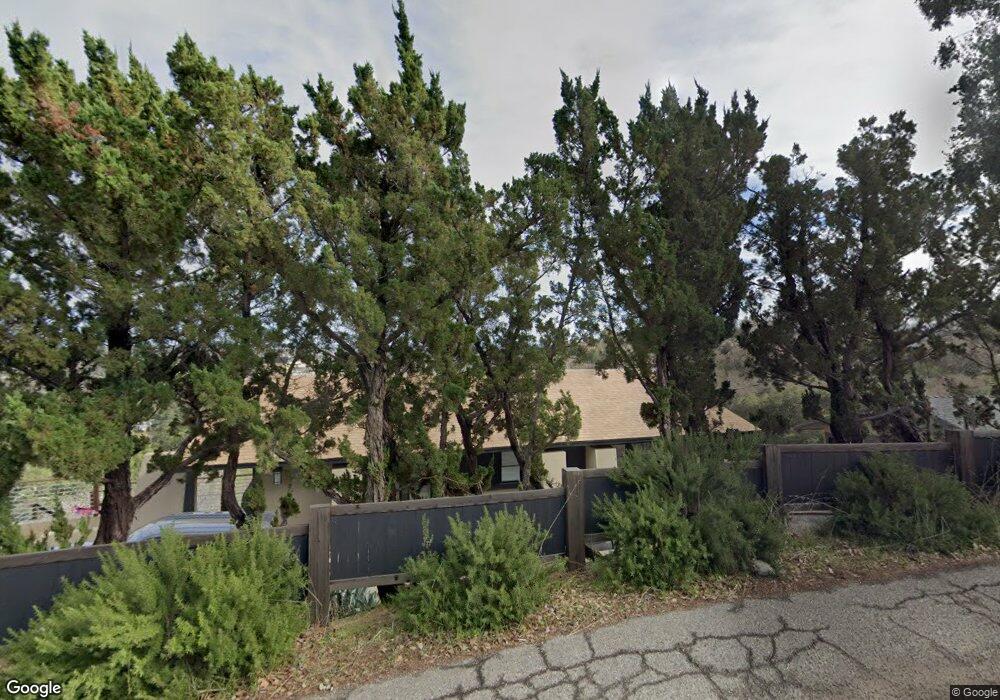
30 Hillcrest Dr Paso Robles, CA 93446
Estimated Value: $852,000 - $967,152
3
Beds
2
Baths
1,980
Sq Ft
$451/Sq Ft
Est. Value
About This Home
This home is located at 30 Hillcrest Dr, Paso Robles, CA 93446 and is currently estimated at $892,038, approximately $450 per square foot. 30 Hillcrest Dr is a home located in San Luis Obispo County with nearby schools including Glen Speck Elementary School, George H. Flamson Middle School, and Paso Robles High School.
Ownership History
Date
Name
Owned For
Owner Type
Purchase Details
Closed on
Dec 15, 2005
Sold by
A & C Funding Inc
Bought by
Cochran Colleen L
Current Estimated Value
Home Financials for this Owner
Home Financials are based on the most recent Mortgage that was taken out on this home.
Original Mortgage
$50,500
Outstanding Balance
$28,372
Interest Rate
6.36%
Mortgage Type
Credit Line Revolving
Estimated Equity
$863,666
Purchase Details
Closed on
Jan 17, 1995
Sold by
Johnson Thomas D and Johnson Paula M
Bought by
Alley Raymond G and Cardenas Nyla J
Create a Home Valuation Report for This Property
The Home Valuation Report is an in-depth analysis detailing your home's value as well as a comparison with similar homes in the area
Purchase History
| Date | Buyer | Sale Price | Title Company |
|---|---|---|---|
| Cochran Colleen L | $505,000 | Fidelity Title Company | |
| Alley Raymond G | -- | First American Title Ins Co |
Source: Public Records
Mortgage History
| Date | Status | Borrower | Loan Amount |
|---|---|---|---|
| Open | Cochran Colleen L | $50,500 | |
| Open | Cochran Colleen L | $404,000 |
Source: Public Records
Tax History
| Year | Tax Paid | Tax Assessment Tax Assessment Total Assessment is a certain percentage of the fair market value that is determined by local assessors to be the total taxable value of land and additions on the property. | Land | Improvement |
|---|---|---|---|---|
| 2025 | $7,444 | $690,105 | $368,968 | $321,137 |
| 2024 | $7,321 | $676,575 | $361,734 | $314,841 |
| 2023 | $7,321 | $663,310 | $354,642 | $308,668 |
| 2022 | $7,211 | $650,305 | $347,689 | $302,616 |
| 2021 | $6,439 | $580,000 | $335,000 | $245,000 |
| 2020 | $6,137 | $555,000 | $300,000 | $255,000 |
| 2019 | $6,171 | $555,000 | $300,000 | $255,000 |
| 2018 | $6,209 | $555,000 | $300,000 | $255,000 |
| 2017 | $5,466 | $510,000 | $270,000 | $240,000 |
| 2016 | $5,227 | $488,000 | $260,000 | $228,000 |
| 2015 | $4,759 | $440,000 | $235,000 | $205,000 |
| 2014 | $4,686 | $440,000 | $235,000 | $205,000 |
Source: Public Records
Map
Nearby Homes
- 26 Hillcrest Dr
- 1525 Filbert St
- 2 Hillcrest Dr
- 85 15th St
- 89 15th St
- 33 Hillcrest Dr
- 10 Hillcrest Dr
- 34 Hillcrest Dr
- 95 15th St
- 12 Hillcrest Dr
- 104 16th St Unit Wine Country Studio
- 9 Hillcrest Dr
- 103 15th St Unit A16
- 44 Hillcrest Dr
- 31 Terrace Hill Dr
- 15 Hillcrest Dr
- 124 16th St
- 107 16th St
- 111 15th St
Your Personal Tour Guide
Ask me questions while you tour the home.