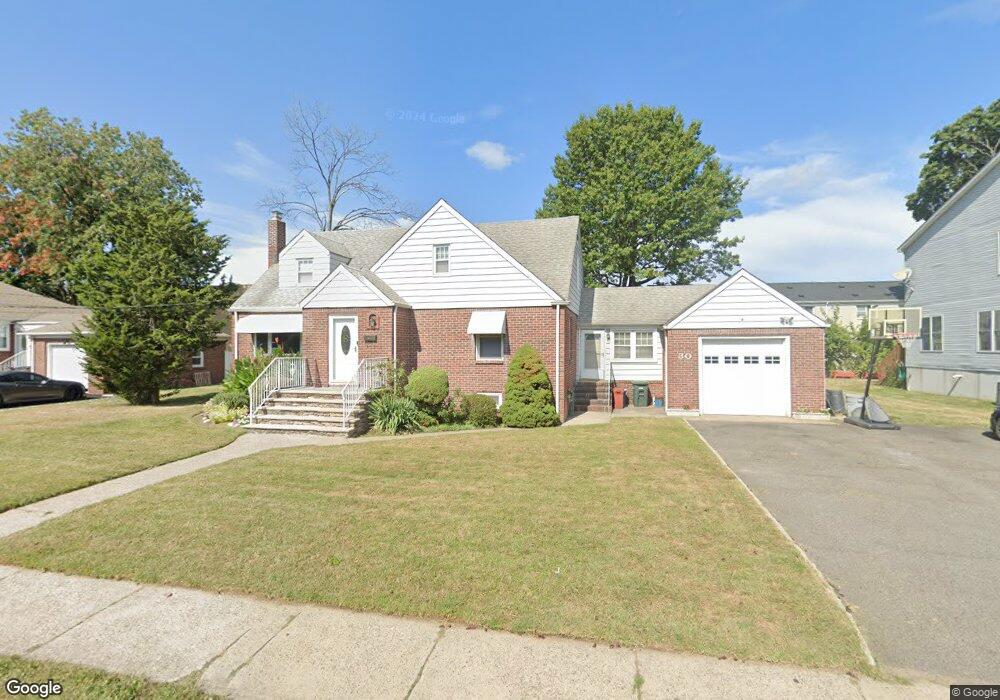
30 Hoffman St South Hackensack, NJ 07606
Estimated Value: $657,578 - $734,000
Studio
--
Bath
1,976
Sq Ft
$358/Sq Ft
Est. Value
About This Home
This home is located at 30 Hoffman St, South Hackensack, NJ 07606 and is currently estimated at $706,895, approximately $357 per square foot. 30 Hoffman St is a home located in Bergen County with nearby schools including Memorial Elementary School and George Washington School.
Ownership History
Date
Name
Owned For
Owner Type
Purchase Details
Closed on
Jun 26, 2000
Sold by
Melillo Marie
Bought by
Vigilanti June M
Current Estimated Value
Create a Home Valuation Report for This Property
The Home Valuation Report is an in-depth analysis detailing your home's value as well as a comparison with similar homes in the area
Home Values in the Area
Average Home Value in this Area
Purchase History
| Date | Buyer | Sale Price | Title Company |
|---|---|---|---|
| Vigilanti June M | -- | -- |
Source: Public Records
Tax History
| Year | Tax Paid | Tax Assessment Tax Assessment Total Assessment is a certain percentage of the fair market value that is determined by local assessors to be the total taxable value of land and additions on the property. | Land | Improvement |
|---|---|---|---|---|
| 2025 | $9,627 | $527,800 | $244,200 | $283,600 |
| 2024 | $9,581 | $491,400 | $229,900 | $261,500 |
| 2023 | $9,012 | $449,600 | $222,800 | $226,800 |
| 2022 | $9,012 | $408,700 | $194,500 | $214,200 |
| 2021 | $8,392 | $359,500 | $164,200 | $195,300 |
| 2020 | $9,461 | $352,500 | $161,900 | $190,600 |
| 2019 | $9,445 | $345,600 | $158,100 | $187,500 |
| 2018 | $9,405 | $340,900 | $156,600 | $184,300 |
| 2017 | $9,331 | $335,900 | $154,700 | $181,200 |
| 2016 | $9,016 | $326,200 | $150,000 | $176,200 |
| 2015 | $8,787 | $320,000 | $146,200 | $173,800 |
| 2014 | $8,611 | $318,000 | $143,500 | $174,500 |
Source: Public Records
Map
Nearby Homes
- 222 Washington Ave
- 75 Cleveland St
- 99 Kansas St
- 113 Kansas St
- 115 Kansas St
- 84 Kansas St
- 337 Hudson St
- 9 Vreeland Ave Unit 3A
- 418 Taylor Ave
- 39 Union St Unit 105
- 110 Sussex St Unit 2F
- 74 Union St
- 75 Union St Unit 5E
- 467 Hudson St
- 115 River Rd
- 115 Polifly Rd Unit 4F
- 115 Polifly Rd Unit 5D
- 72 Lawrence St
- 38 Chestnut Ave
- 65 Mcdougall Ln
- 50 Hoffman St Unit B
- 50 Hoffman St Unit A
- 50 Hoffman St
- 50 Hoffman St
- 26 Hoffman St
- 70 Hoffman St
- 35-37-37 Hoffman St
- 35-37 Hoffman St
- 37 Hoffman St
- 31 Hoffman St
- 25 Hoffman St
- 35 Hoffman St Unit 37
- 18 Hoffman St
- 21 Hoffman St
- 41 Hoffman St Unit 2
- 41 Hoffman St
- 217 S Main St
- 211 S Main St
- 17 Hoffman St
- 209 S Main St
Your Personal Tour Guide
Ask me questions while you tour the home.