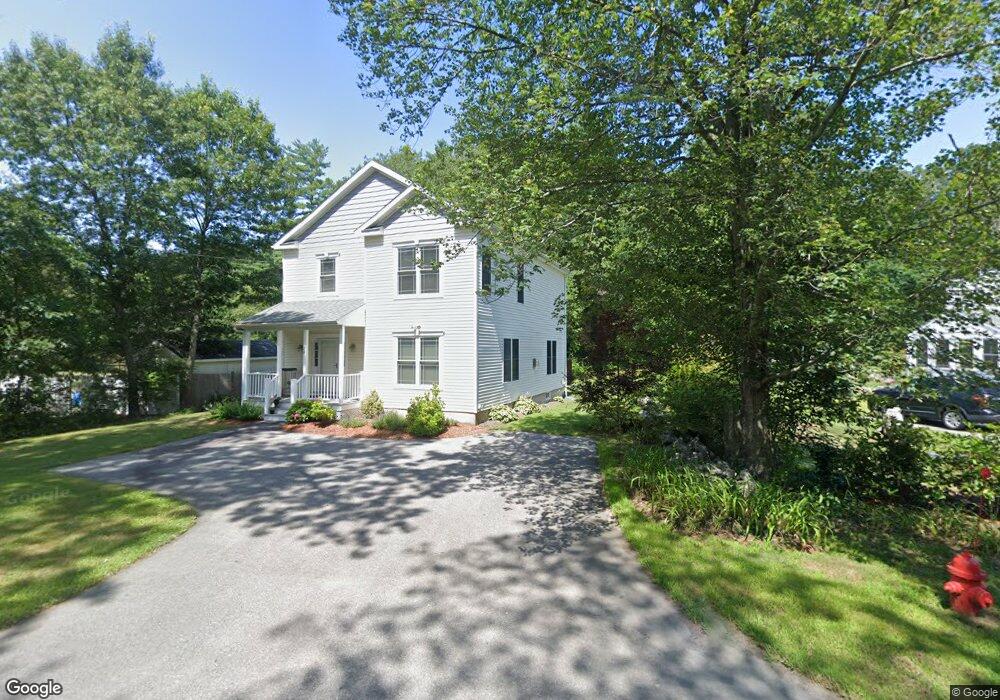
30 Jewett St Georgetown, MA 01833
Estimated Value: $758,000 - $797,000
3
Beds
3
Baths
1,925
Sq Ft
$403/Sq Ft
Est. Value
About This Home
This home is located at 30 Jewett St, Georgetown, MA 01833 and is currently estimated at $775,561, approximately $402 per square foot. 30 Jewett St is a home located in Essex County with nearby schools including Perley Elementary School, Penn Brook School, and Georgetown High School.
Ownership History
Date
Name
Owned For
Owner Type
Purchase Details
Closed on
Jul 5, 2017
Sold by
Bounsy Thao and Lin Lay H
Bought by
Lin Lay H
Current Estimated Value
Purchase Details
Closed on
Nov 22, 2011
Sold by
Cavatorta Edward
Bought by
Bounsy Thao and Lin Layhong
Home Financials for this Owner
Home Financials are based on the most recent Mortgage that was taken out on this home.
Original Mortgage
$200,000
Interest Rate
3.92%
Mortgage Type
Purchase Money Mortgage
Purchase Details
Closed on
Jan 14, 2011
Sold by
Reatined Realty Inc
Bought by
Cavatorta Edward
Purchase Details
Closed on
Apr 16, 2009
Sold by
Ross Karen A
Bought by
Retained Realty Inc
Purchase Details
Closed on
Jul 13, 2007
Sold by
Kelley Barbara J and Ross Karen A
Bought by
Ross Karen A
Home Financials for this Owner
Home Financials are based on the most recent Mortgage that was taken out on this home.
Original Mortgage
$123,000
Interest Rate
6.48%
Mortgage Type
Purchase Money Mortgage
Create a Home Valuation Report for This Property
The Home Valuation Report is an in-depth analysis detailing your home's value as well as a comparison with similar homes in the area
Home Values in the Area
Average Home Value in this Area
Purchase History
| Date | Buyer | Sale Price | Title Company |
|---|---|---|---|
| Lin Lay H | -- | -- | |
| Bounsy Thao | $395,000 | -- | |
| Cavatorta Edward | $90,000 | -- | |
| Retained Realty Inc | $167,338 | -- | |
| Ross Karen A | -- | -- |
Source: Public Records
Mortgage History
| Date | Status | Borrower | Loan Amount |
|---|---|---|---|
| Previous Owner | Ross Karen A | $200,000 | |
| Previous Owner | Ross Karen A | $123,000 |
Source: Public Records
Tax History Compared to Growth
Tax History
| Year | Tax Paid | Tax Assessment Tax Assessment Total Assessment is a certain percentage of the fair market value that is determined by local assessors to be the total taxable value of land and additions on the property. | Land | Improvement |
|---|---|---|---|---|
| 2025 | $7,499 | $678,000 | $257,300 | $420,700 |
| 2024 | $7,505 | $598,000 | $177,500 | $420,500 |
| 2023 | $7,034 | $541,900 | $177,500 | $364,400 |
| 2022 | $6,877 | $488,400 | $154,300 | $334,100 |
| 2021 | $6,756 | $425,200 | $154,300 | $270,900 |
| 2020 | $6,769 | $425,200 | $154,300 | $270,900 |
| 2019 | $6,662 | $422,200 | $151,300 | $270,900 |
| 2018 | $6,705 | $422,200 | $151,300 | $270,900 |
| 2017 | $6,474 | $399,400 | $151,300 | $248,100 |
| 2016 | $6,259 | $394,400 | $151,300 | $243,100 |
| 2015 | $6,114 | $381,400 | $151,300 | $230,100 |
| 2014 | $5,359 | $381,400 | $151,300 | $230,100 |
Source: Public Records
Map
Nearby Homes