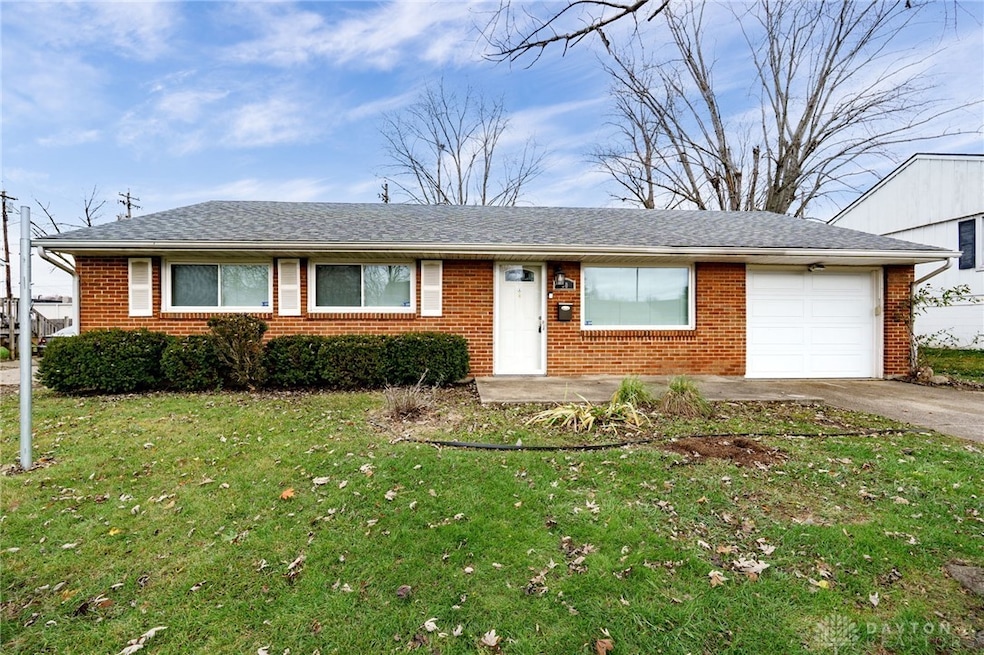
30 John St Franklin, OH 45005
Estimated payment $1,240/month
Highlights
- No HOA
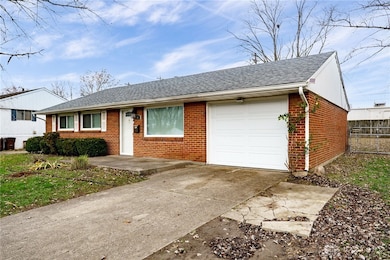
- 1 Car Attached Garage
- Bathroom on Main Level
- Porch
- Patio
- Shed
About This Home
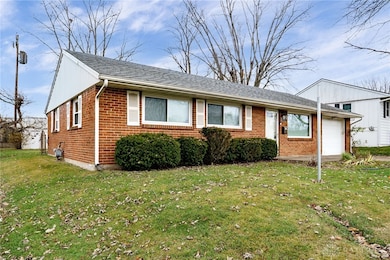
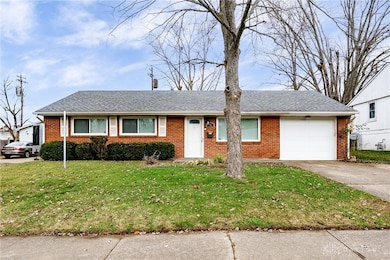
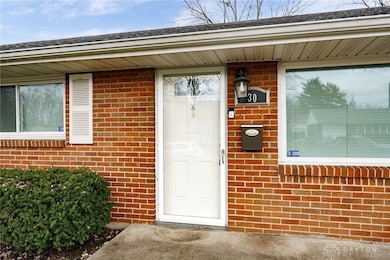
Welcome to 30 John St, a beautifully maintained brick home ideally located just minutes from I-75 for easy commuting. This inviting 3-bedroom, 2 full-bath property has been freshly painted and thoughtfully updated, making it truly move-in ready.
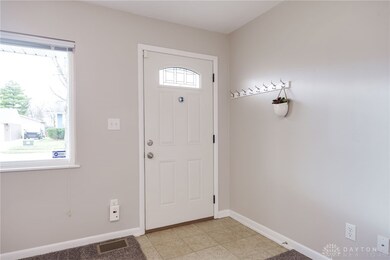
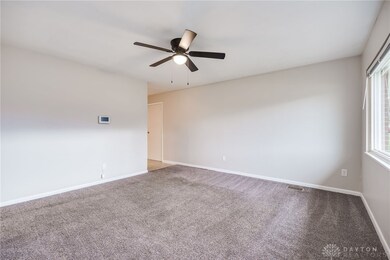
Step inside to find a bright, comfortable layout with new paddle fans, well-kept living spaces, and a fully equipped kitchen. All appliances stay, including the washer and dryer, offering added convenience. Outside, enjoy a large backyard perfect for entertaining or relaxing, complete with a covered patio for year-round enjoyment. Additional updates include a newer garage door and neat curb appeal that enhances the home’s charm. Whether you're a first-time buyer or looking to downsize, this Franklin gem has everything you need. Don’t miss your chance to make it yours!
Listing Agent
NavX Realty, LLC Brokerage Phone: (937) 530-6289 License #2005017251 Listed on: 11/28/2025

Open House Schedule
-
Thursday, December 04, 20256:00 to 7:00 pm12/4/2025 6:00:00 PM +00:0012/4/2025 7:00:00 PM +00:00Add to Calendar
Home Details
Home Type
- Single Family
Est. Annual Taxes
- $2,298
Year Built
- 1961
Lot Details
- 8,775 Sq Ft Lot
- Fenced
Parking
- 1 Car Attached Garage
Home Design
- Brick Exterior Construction
- Slab Foundation
Interior Spaces
- 999 Sq Ft Home
- 1-Story Property
- Ceiling Fan
- Fire and Smoke Detector
Kitchen
- Range
- Dishwasher
- Laminate Countertops
Bedrooms and Bathrooms
- 3 Bedrooms
- Bathroom on Main Level
- 2 Full Bathrooms
Laundry
- Dryer
- Washer
Outdoor Features
- Patio
- Shed
- Porch
Utilities
- Forced Air Heating and Cooling System
- Heating System Uses Natural Gas
- Gas Water Heater
Community Details
- No Home Owners Association
- Layne Crest Park 3 Subdivision
Listing and Financial Details
- Assessor Parcel Number 04263770050
Map
Home Values in the Area
Average Home Value in this Area
Tax History
| Year | Tax Paid | Tax Assessment Tax Assessment Total Assessment is a certain percentage of the fair market value that is determined by local assessors to be the total taxable value of land and additions on the property. | Land | Improvement |
|---|---|---|---|---|
| 2024 | $2,298 | $47,760 | $15,750 | $32,010 |
| 2023 | $2,072 | $35,266 | $9,684 | $25,581 |
| 2022 | $2,036 | $35,266 | $9,685 | $25,582 |
| 2021 | $1,733 | $35,266 | $9,685 | $25,582 |
| 2020 | $1,802 | $28,672 | $7,875 | $20,797 |
| 2019 | $1,658 | $28,672 | $7,875 | $20,797 |
| 2018 | $1,479 | $28,672 | $7,875 | $20,797 |
| 2017 | $1,502 | $26,646 | $7,480 | $19,166 |
| 2016 | $1,531 | $26,646 | $7,480 | $19,166 |
| 2015 | $1,531 | $26,646 | $7,480 | $19,166 |
| 2014 | $1,515 | $26,650 | $7,480 | $19,170 |
| 2013 | $1,301 | $31,170 | $8,750 | $22,420 |
Property History
| Date | Event | Price | List to Sale | Price per Sq Ft |
|---|---|---|---|---|
| 11/28/2025 11/28/25 | For Sale | $198,900 | -- | $199 / Sq Ft |
Purchase History
| Date | Type | Sale Price | Title Company |
|---|---|---|---|
| Survivorship Deed | $105,000 | None Available | |
| Sheriffs Deed | $50,000 | None Available | |
| Warranty Deed | $76,900 | First Ctrl Land Title Agency | |
| Quit Claim Deed | -- | Attorney |
Mortgage History
| Date | Status | Loan Amount | Loan Type |
|---|---|---|---|
| Previous Owner | $84,000 | Purchase Money Mortgage | |
| Previous Owner | $79,437 | VA |
Source: Dayton REALTORS®
MLS Number: 948549
APN: 04-26-377-005
Disclaimer: Certain information contained herein is derived from information provided by parties other than Homes.com. All information provided is deemed reliable, but is not guaranteed to be accurate and should be independently verified.
![]() The information is being provided by Dayton Area Board of Realtors MLS. Information deemed reliable but not guaranteed. Information is provided for the consumer's personal, non-commercial use, and may not be used for any purpose other than the identification of potential properties for purchase. Copyright 2025 Dayton Area Board of Realtors MLS. All Rights Reserved.
The information is being provided by Dayton Area Board of Realtors MLS. Information deemed reliable but not guaranteed. Information is provided for the consumer's personal, non-commercial use, and may not be used for any purpose other than the identification of potential properties for purchase. Copyright 2025 Dayton Area Board of Realtors MLS. All Rights Reserved.
- 111 Moore Dr
- 747 David Blvd
- 760 David Blvd
- 445 Beam Dr
- 520 Arlington Ave
- 779 Martha Dr
- 821 Arlington Ave
- 56 Skokiaan Dr
- 104 Mound Builder Place
- 551 E 2nd St
- 590 Kristine Ln
- 995 E 4th St
- 388 Thomas Dr
- 452 Greenup Ct
- 16 Harding Ct
- 141 Arlington Ave
- 0 Victoria Dr Unit 942075
- 0 Victoria Dr Unit 1852824
- 187 Minnick St
- 441 Sunnybrook Dr
- 2 Emerald Way
- 510 Arlington Dr
- 101 N Main St Unit 3
- 601 Moses Dr Unit 1
- 8967 Cam Dr
- 140 Redbud Dr
- 475 Gilpin Dr
- 950 Dubois Rd
- 5019 Waterford Dr
- 5019 Waterford Ln
- 5017 Waterford Ln
- 10501 Landing Way
- 80 Gregg Ct
- 45 Haverstraw Place
- 2991 Austin Springs Blvd
- 2895 Taos Dr
- 9600 Summit Point Dr
- 5549 Innovation Dr
- 20 Chris Ln Unit 57
- 9 Cozy Ln