30 Juniper St Roxbury, MA 02119
Fort Hill NeighborhoodEstimated Value: $761,000 - $1,058,000
4
Beds
2
Baths
3,246
Sq Ft
$273/Sq Ft
Est. Value
About This Home
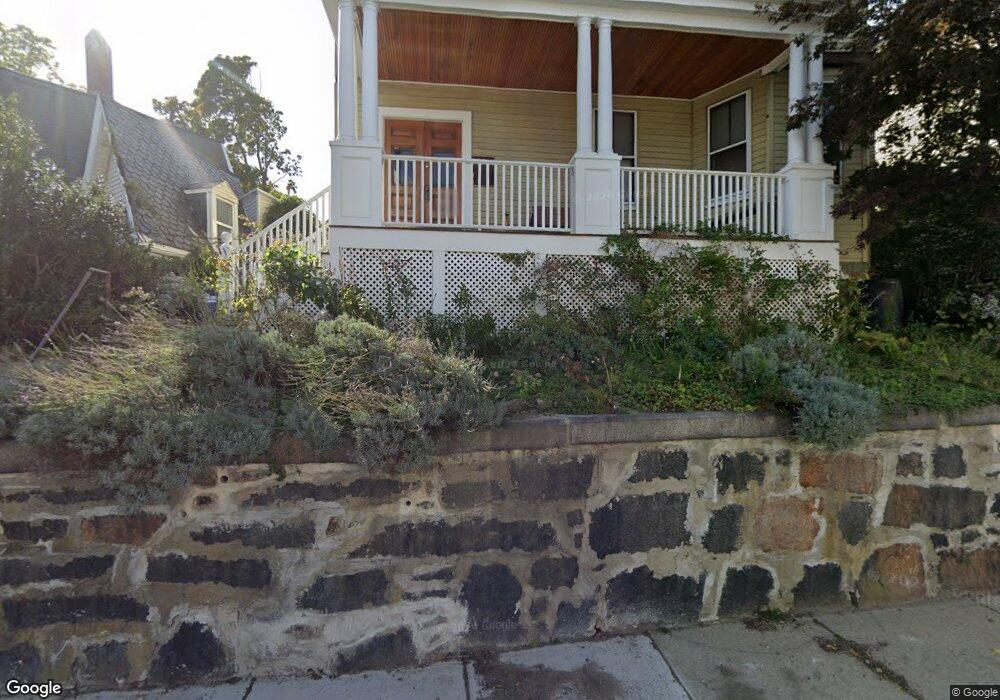
This home is located at 30 Juniper St, Roxbury, MA 02119 and is currently estimated at $886,316, approximately $273 per square foot. 30 Juniper St is a home located in Suffolk County with nearby schools including City on a Hill Charter Public School and Paige Academy.
Ownership History
Date
Name
Owned For
Owner Type
Purchase Details
Closed on
Nov 20, 2006
Sold by
Raymond Kathleen J
Bought by
Murray Michelle
Current Estimated Value
Home Financials for this Owner
Home Financials are based on the most recent Mortgage that was taken out on this home.
Original Mortgage
$345,000
Outstanding Balance
$205,444
Interest Rate
6.33%
Mortgage Type
Purchase Money Mortgage
Estimated Equity
$680,872
Create a Home Valuation Report for This Property
The Home Valuation Report is an in-depth analysis detailing your home's value as well as a comparison with similar homes in the area
Home Values in the Area
Average Home Value in this Area
Purchase History
| Date | Buyer | Sale Price | Title Company |
|---|---|---|---|
| Murray Michelle | $365,000 | -- |
Source: Public Records
Mortgage History
| Date | Status | Borrower | Loan Amount |
|---|---|---|---|
| Open | Murray Michelle | $345,000 |
Source: Public Records
Tax History
| Year | Tax Paid | Tax Assessment Tax Assessment Total Assessment is a certain percentage of the fair market value that is determined by local assessors to be the total taxable value of land and additions on the property. | Land | Improvement |
|---|---|---|---|---|
| 2025 | $9,091 | $785,100 | $315,200 | $469,900 |
| 2024 | $8,186 | $751,000 | $214,800 | $536,200 |
| 2023 | $7,756 | $722,200 | $206,600 | $515,600 |
| 2022 | $7,143 | $656,500 | $187,800 | $468,700 |
| 2021 | $6,547 | $613,600 | $175,500 | $438,100 |
| 2020 | $6,373 | $603,500 | $169,900 | $433,600 |
| 2019 | $5,948 | $564,300 | $130,100 | $434,200 |
| 2018 | $5,129 | $489,400 | $130,100 | $359,300 |
| 2017 | $5,141 | $485,500 | $130,100 | $355,400 |
| 2016 | $3,958 | $359,805 | $107,983 | $251,822 |
| 2015 | $3,680 | $303,900 | $103,400 | $200,500 |
| 2014 | $3,351 | $266,400 | $103,400 | $163,000 |
Source: Public Records
Map
Nearby Homes
- 9 W Cedar St Unit 1
- 16 Hawthorne St
- 64 Alpine St Unit 104
- 64 Alpine St Unit 304
- 65 Lambert Ave
- 51 Saint James St
- 156-160 Highland St Unit 156
- 187 Highland St
- 5 Valentine St Unit 1
- 10 Linwood St
- 27 Dudley St
- 48-50 Dudley St
- 22 Rockville Park
- 20 Rockville Park
- 150 Walnut Ave
- 16 Mayfair St
- 8 Humboldt Ave Unit 2
- 2856 Washington St
- 21 Marcella St Unit 2
- 22-22A Montrose St
- 30 Juniper St Unit 1
- 26 Juniper St
- 34 Juniper St Unit 36
- 34 Juniper St Unit 36
- 34 Juniper St Unit 36
- 34 Juniper St Unit 1
- 34 Juniper St Unit 3
- 34 Juniper St Unit 2
- 38 Juniper St Unit 1
- 33 Juniper St
- 35 Juniper St Unit 1
- 31 Juniper St Unit 1
- 35 Juniper St
- 31 Juniper St Unit 35
- 33 Juniper St Unit 33
- 31 Juniper St Unit 31
- 35 Juniper St Unit 35
- 31-35 Juniper St Unit 1
- 31-35 Juniper St Unit 31-35 Juniper Street
- 31 Juniper St
Your Personal Tour Guide
Ask me questions while you tour the home.