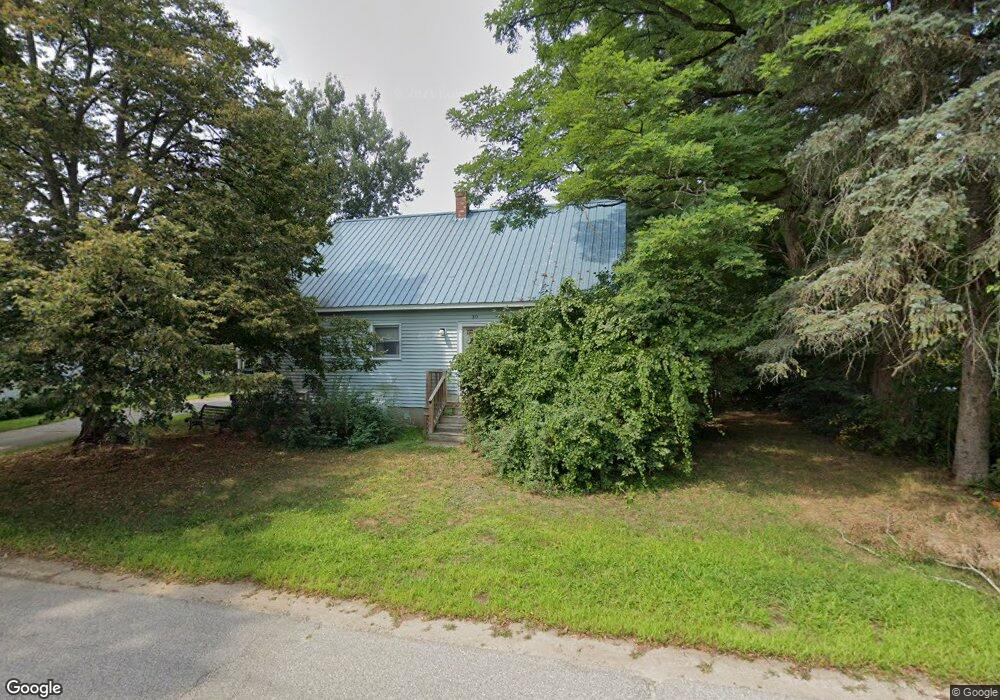
30 Kennett St Conway, NH 03818
Estimated Value: $394,000 - $460,000
2
Beds
3
Baths
1,764
Sq Ft
$240/Sq Ft
Est. Value
About This Home
This home is located at 30 Kennett St, Conway, NH 03818 and is currently estimated at $423,758, approximately $240 per square foot. 30 Kennett St is a home located in Carroll County with nearby schools including A. Crosby Kennett Middle School, Kennett High School, and Robert Frost Charter School.
Ownership History
Date
Name
Owned For
Owner Type
Purchase Details
Closed on
Aug 11, 2006
Sold by
Parks Betty B Est
Bought by
Stone George R and Stone Shirley E
Current Estimated Value
Home Financials for this Owner
Home Financials are based on the most recent Mortgage that was taken out on this home.
Original Mortgage
$176,000
Outstanding Balance
$105,897
Interest Rate
6.8%
Mortgage Type
Purchase Money Mortgage
Estimated Equity
$317,861
Create a Home Valuation Report for This Property
The Home Valuation Report is an in-depth analysis detailing your home's value as well as a comparison with similar homes in the area
Home Values in the Area
Average Home Value in this Area
Purchase History
| Date | Buyer | Sale Price | Title Company |
|---|---|---|---|
| Stone George R | $190,000 | -- |
Source: Public Records
Mortgage History
| Date | Status | Borrower | Loan Amount |
|---|---|---|---|
| Open | Stone George R | $176,000 |
Source: Public Records
Tax History Compared to Growth
Tax History
| Year | Tax Paid | Tax Assessment Tax Assessment Total Assessment is a certain percentage of the fair market value that is determined by local assessors to be the total taxable value of land and additions on the property. | Land | Improvement |
|---|---|---|---|---|
| 2024 | $4,596 | $357,700 | $76,100 | $281,600 |
| 2023 | $4,264 | $357,700 | $76,100 | $281,600 |
| 2022 | $3,762 | $193,300 | $70,600 | $122,700 |
| 2021 | $3,159 | $193,300 | $70,600 | $122,700 |
| 2020 | $3,549 | $193,300 | $70,600 | $122,700 |
| 2019 | $3,036 | $175,300 | $52,600 | $122,700 |
| 2018 | $3,344 | $153,800 | $52,600 | $101,200 |
| 2017 | $3,073 | $153,800 | $52,600 | $101,200 |
| 2016 | $2,970 | $153,800 | $52,600 | $101,200 |
| 2015 | $2,936 | $153,800 | $52,600 | $101,200 |
| 2014 | $2,901 | $153,800 | $52,600 | $101,200 |
| 2013 | $2,799 | $156,700 | $52,600 | $104,100 |
Source: Public Records
Map
Nearby Homes
- 77 Kennett St
- lots42,43,44,49 G St
- 40 Butternut Ln
- 86 I St
- 122 Mountain View Dr
- 7 Wildwood Rd
- 6 Main St
- 20 Washington St
- 58 Wilder St
- 237 Eaton Rd
- 0 W Side Rd Unit 54 5049810
- 369 Tasker Hill Rd
- 115 Swift Valley Rd
- 123 Oxbow Ln
- 9 E Side Rd
- 12 Oxbow Ln
- 196 E Main St Unit 5 (old 103)
- 143 Holly Ridge Ln
- 515 W Side Rd
- 149 Allard Hill Rd