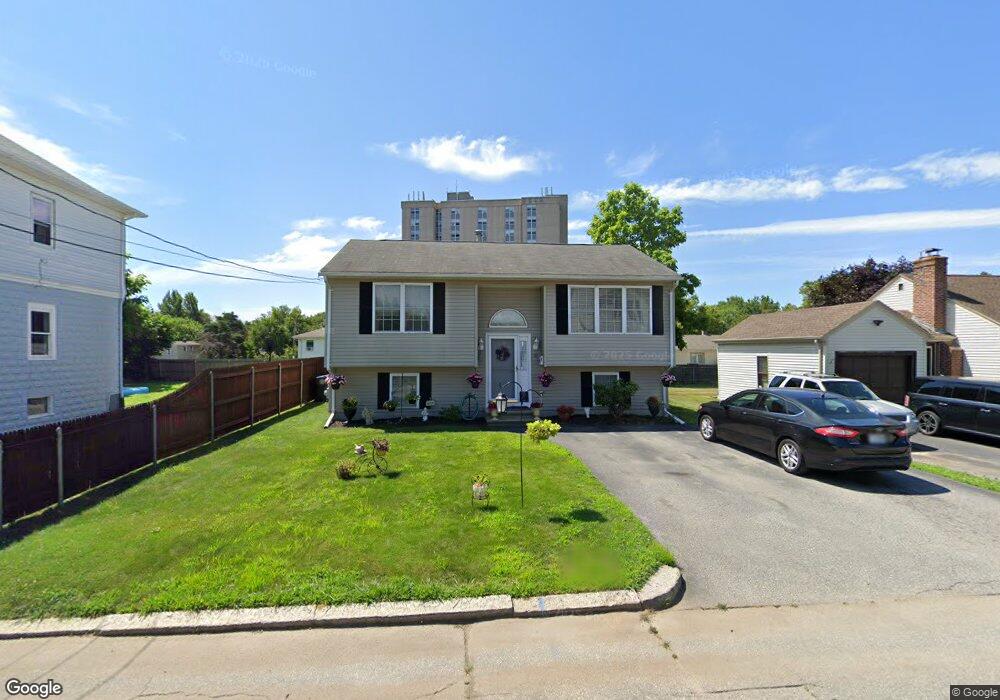
30 Knight St Cranston, RI 02920
Knightsville NeighborhoodEstimated Value: $373,000 - $519,000
2
Beds
1
Bath
34
Sq Ft
$12,810/Sq Ft
Est. Value
About This Home
This home is located at 30 Knight St, Cranston, RI 02920 and is currently estimated at $435,534, approximately $12,809 per square foot. 30 Knight St is a home located in Providence County with nearby schools including George J. Peters School, Western Hills Middle School, and Cranston High School West.
Ownership History
Date
Name
Owned For
Owner Type
Purchase Details
Closed on
May 1, 2000
Sold by
Ciccarone Anthony P
Bought by
Estrela Louis and Estrela Patricia
Current Estimated Value
Purchase Details
Closed on
Dec 29, 1999
Sold by
A Ialongo Building
Bought by
Hebert William and Hebert Deborah
Create a Home Valuation Report for This Property
The Home Valuation Report is an in-depth analysis detailing your home's value as well as a comparison with similar homes in the area
Home Values in the Area
Average Home Value in this Area
Purchase History
| Date | Buyer | Sale Price | Title Company |
|---|---|---|---|
| Estrela Louis | $9,000 | -- | |
| Hebert William | $118,000 | -- |
Source: Public Records
Mortgage History
| Date | Status | Borrower | Loan Amount |
|---|---|---|---|
| Open | Hebert William | $40,000 | |
| Closed | Hebert William | $36,134 | |
| Open | Hebert William | $136,000 |
Source: Public Records
Tax History Compared to Growth
Tax History
| Year | Tax Paid | Tax Assessment Tax Assessment Total Assessment is a certain percentage of the fair market value that is determined by local assessors to be the total taxable value of land and additions on the property. | Land | Improvement |
|---|---|---|---|---|
| 2025 | $4,768 | $343,500 | $106,900 | $236,600 |
| 2024 | $4,675 | $343,500 | $106,900 | $236,600 |
| 2023 | $4,631 | $245,000 | $70,400 | $174,600 |
| 2022 | $4,535 | $245,000 | $70,400 | $174,600 |
| 2021 | $4,410 | $245,000 | $70,400 | $174,600 |
| 2020 | $4,459 | $214,700 | $67,000 | $147,700 |
| 2019 | $4,459 | $214,700 | $67,000 | $147,700 |
| 2018 | $4,356 | $214,700 | $67,000 | $147,700 |
| 2017 | $4,285 | $186,800 | $60,300 | $126,500 |
| 2016 | $4,194 | $186,800 | $60,300 | $126,500 |
| 2015 | $4,194 | $186,800 | $60,300 | $126,500 |
| 2014 | $3,992 | $174,800 | $60,300 | $114,500 |
Source: Public Records
Map
Nearby Homes