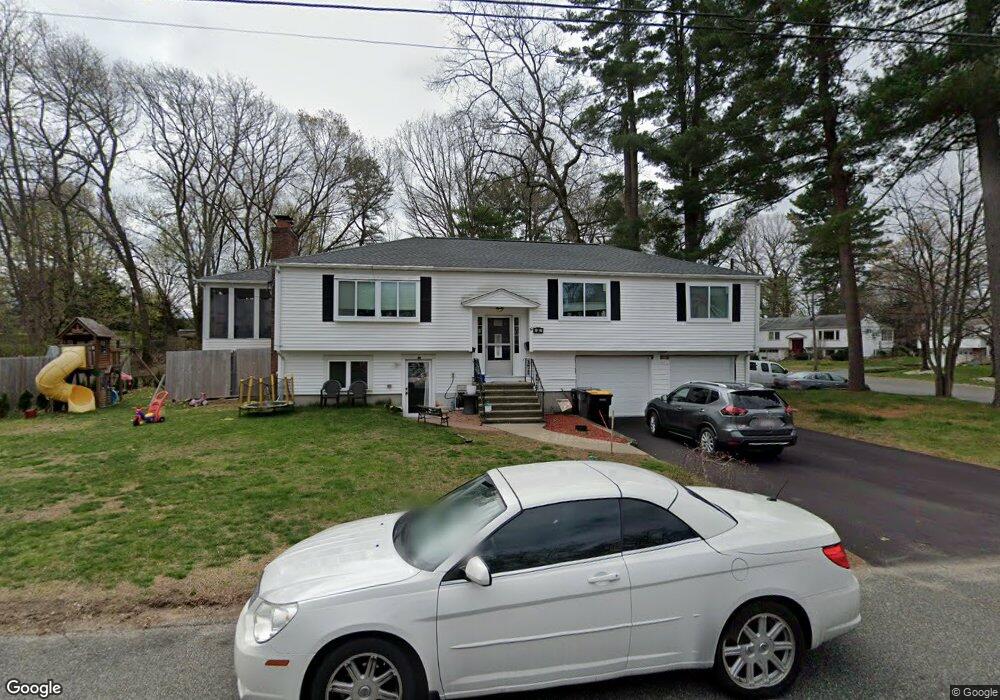
30 Laverdure Cir Framingham, MA 01701
Nobscot NeighborhoodEstimated Value: $629,000 - $758,000
3
Beds
4
Baths
1,500
Sq Ft
$461/Sq Ft
Est. Value
About This Home
This home is located at 30 Laverdure Cir, Framingham, MA 01701 and is currently estimated at $690,954, approximately $460 per square foot. 30 Laverdure Cir is a home located in Middlesex County with nearby schools including Framingham High School, MetroWest Jewish Day School, and Saint Bridget School.
Ownership History
Date
Name
Owned For
Owner Type
Purchase Details
Closed on
Jun 3, 2024
Sold by
Poole Cynthia
Bought by
Cynthia Poole Ret and Poole
Current Estimated Value
Purchase Details
Closed on
Aug 8, 2011
Sold by
Paula Cynamon Ret and Cynamon
Bought by
Poole Cynthia
Purchase Details
Closed on
Apr 22, 2008
Sold by
Cynamon Joseph J and Cynamon Paula D
Bought by
Paula Cynamon Ret and Cynamon
Create a Home Valuation Report for This Property
The Home Valuation Report is an in-depth analysis detailing your home's value as well as a comparison with similar homes in the area
Home Values in the Area
Average Home Value in this Area
Purchase History
| Date | Buyer | Sale Price | Title Company |
|---|---|---|---|
| Cynthia Poole Ret | -- | None Available | |
| Cynthia Poole Ret | -- | None Available | |
| Cynthia Poole Ret | -- | None Available | |
| Poole Cynthia | $285,000 | -- | |
| Paula Cynamon Ret | -- | -- | |
| Poole Cynthia | $285,000 | -- | |
| Paula Cynamon Ret | -- | -- |
Source: Public Records
Tax History Compared to Growth
Tax History
| Year | Tax Paid | Tax Assessment Tax Assessment Total Assessment is a certain percentage of the fair market value that is determined by local assessors to be the total taxable value of land and additions on the property. | Land | Improvement |
|---|---|---|---|---|
| 2025 | $6,605 | $553,200 | $259,500 | $293,700 |
| 2024 | $6,104 | $489,900 | $231,700 | $258,200 |
| 2023 | $5,735 | $438,100 | $206,800 | $231,300 |
| 2022 | $5,515 | $401,400 | $187,700 | $213,700 |
| 2021 | $5,239 | $372,900 | $180,400 | $192,500 |
| 2020 | $5,297 | $353,600 | $163,900 | $189,700 |
| 2019 | $5,295 | $344,300 | $163,900 | $180,400 |
| 2018 | $5,263 | $322,500 | $157,800 | $164,700 |
| 2017 | $5,140 | $307,600 | $153,200 | $154,400 |
| 2016 | $4,934 | $283,900 | $153,200 | $130,700 |
| 2015 | $4,936 | $277,000 | $153,100 | $123,900 |
Source: Public Records
Map
Nearby Homes
- 15 Fairbrook Rd
- 1 Brookvale Rd
- 217 Central St
- 82 Joseph Rd
- 163 Water St
- 19 Park Ave
- 14 Francine Rd
- 111 Higgins Rd
- 81 Nicholas Rd Unit B
- 71 Nicholas Rd Unit H
- 24 Pinewood Dr
- 8 Clara Rd
- 33 Highgate Rd
- 8 Elm St Unit 8A
- 10 Victoria Garden Unit A
- 30 Edith Rd
- 53 Davidson Rd
- 1376 Concord St
- 182 Summer St
- 18 Lomas Dr