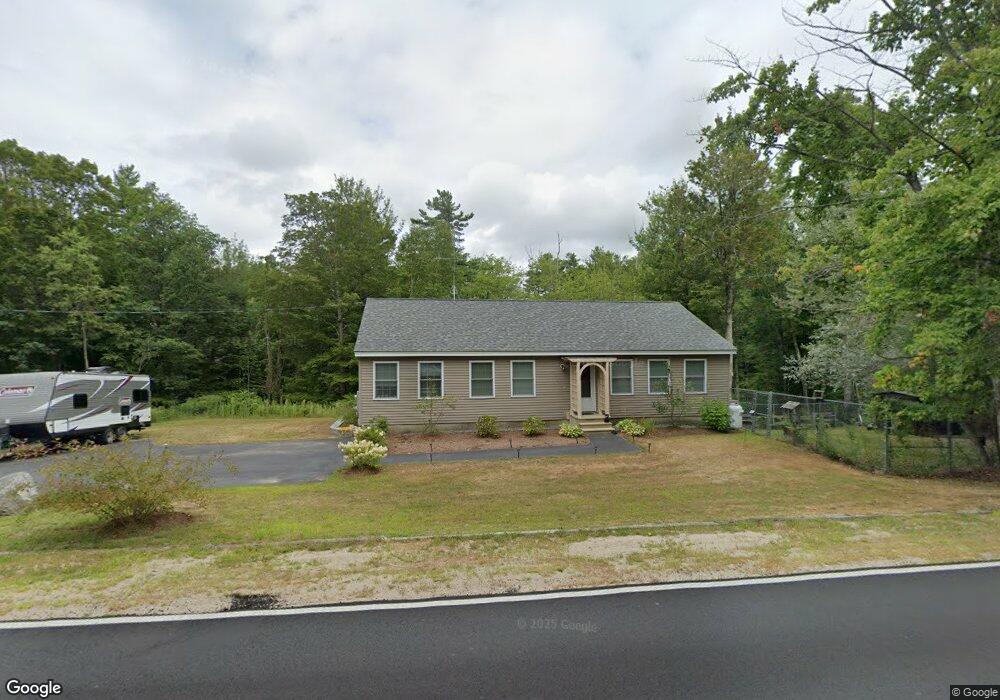
30 Ledge Hill Rd Center Tuftonboro, NH 03816
Estimated Value: $405,000 - $483,000
3
Beds
2
Baths
1,500
Sq Ft
$302/Sq Ft
Est. Value
About This Home
This home is located at 30 Ledge Hill Rd, Center Tuftonboro, NH 03816 and is currently estimated at $452,946, approximately $301 per square foot. 30 Ledge Hill Rd is a home located in Carroll County with nearby schools including Tuftonboro Central School, Kingswood Regional Middle School, and Kingswood Regional High School.
Ownership History
Date
Name
Owned For
Owner Type
Purchase Details
Closed on
Mar 17, 2023
Sold by
Lis Lending Equities Llc
Bought by
Carpenter Amber M and Perkins Christopher J
Current Estimated Value
Home Financials for this Owner
Home Financials are based on the most recent Mortgage that was taken out on this home.
Original Mortgage
$337,250
Outstanding Balance
$325,816
Interest Rate
6.09%
Mortgage Type
Purchase Money Mortgage
Estimated Equity
$127,130
Purchase Details
Closed on
Oct 9, 2014
Sold by
Ahg Props
Bought by
Lis Lending Equities L
Purchase Details
Closed on
May 14, 2009
Sold by
Frenette Henry
Bought by
Ahg Properties Inc
Create a Home Valuation Report for This Property
The Home Valuation Report is an in-depth analysis detailing your home's value as well as a comparison with similar homes in the area
Home Values in the Area
Average Home Value in this Area
Purchase History
| Date | Buyer | Sale Price | Title Company |
|---|---|---|---|
| Carpenter Amber M | $355,000 | None Available | |
| Carpenter Amber M | $355,000 | None Available | |
| Lis Lending Equities L | $170,000 | -- | |
| Lis Lending Equities L | $170,000 | -- | |
| Ahg Properties Inc | $100,000 | -- | |
| Ahg Properties Inc | $100,000 | -- |
Source: Public Records
Mortgage History
| Date | Status | Borrower | Loan Amount |
|---|---|---|---|
| Open | Carpenter Amber M | $337,250 | |
| Closed | Carpenter Amber M | $337,250 | |
| Closed | Ahg Properties Inc | $0 |
Source: Public Records
Tax History Compared to Growth
Tax History
| Year | Tax Paid | Tax Assessment Tax Assessment Total Assessment is a certain percentage of the fair market value that is determined by local assessors to be the total taxable value of land and additions on the property. | Land | Improvement |
|---|---|---|---|---|
| 2024 | $2,389 | $313,500 | $57,600 | $255,900 |
| 2023 | $2,263 | $311,300 | $57,600 | $253,700 |
| 2022 | $2,005 | $311,300 | $57,600 | $253,700 |
| 2021 | $2,140 | $212,300 | $48,000 | $164,300 |
| 2020 | $2,030 | $212,300 | $48,000 | $164,300 |
| 2019 | $2,146 | $212,300 | $48,000 | $164,300 |
| 2018 | $1,502 | $182,800 | $57,000 | $125,800 |
| 2017 | $1,969 | $182,800 | $57,000 | $125,800 |
| 2016 | $1,907 | $182,800 | $57,000 | $125,800 |
| 2015 | $1,899 | $182,800 | $57,000 | $125,800 |
| 2014 | $1,675 | $167,700 | $57,000 | $110,700 |
| 2012 | $1,670 | $182,700 | $68,000 | $114,700 |
Source: Public Records
Map
Nearby Homes
- 23 Ledge Hill Rd
- 106 Middle Rd
- 2 Oak Leaf Ave
- 13 Ridge Field Rd
- 24 Ridge Field Rd
- 17 Federal Corner Rd
- 51 Federal Corner Rd
- Lot 4 Vere Royce Rd
- 61 Dame Rd
- Lot 4 Ridge Field Rd Unit 4
- 24 Shirley Way
- 0 Ledge Hill Rd Unit 7
- 0 N Line Rd Unit 5008080
- 190 Ledge Hill Rd
- 323 Governor Wentworth Hwy
- 175 Mountain Rd
- 123 Mountain Rd
- Lot 25 Ridge Field Rd
- 41 Valley Rd
- 44 Valley Rd