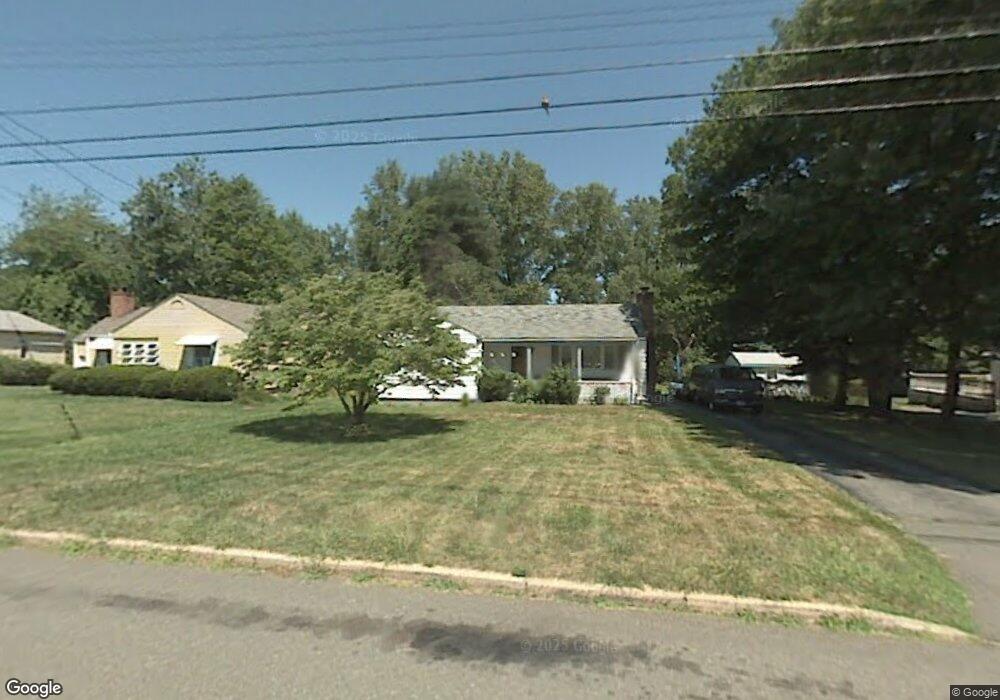
30 Lepage Rd Windsor, CT 06095
Wilson NeighborhoodEstimated Value: $274,000 - $310,000
3
Beds
1
Bath
1,110
Sq Ft
$267/Sq Ft
Est. Value
About This Home
This home is located at 30 Lepage Rd, Windsor, CT 06095 and is currently estimated at $295,817, approximately $266 per square foot. 30 Lepage Rd is a home located in Hartford County with nearby schools including Poquonock Elementary School, Clover Street School, and Sage Park Middle School.
Ownership History
Date
Name
Owned For
Owner Type
Purchase Details
Closed on
Jan 6, 2004
Sold by
Joseph Audwin and Joseph Malwin
Bought by
Cobey Edith and Modeste Omason
Current Estimated Value
Home Financials for this Owner
Home Financials are based on the most recent Mortgage that was taken out on this home.
Original Mortgage
$131,000
Outstanding Balance
$60,618
Interest Rate
5.86%
Mortgage Type
Purchase Money Mortgage
Estimated Equity
$235,199
Purchase Details
Closed on
Dec 22, 1997
Sold by
Bilas Walter Est and Langer
Bought by
Joseph Malvin and Joseph Audwin
Home Financials for this Owner
Home Financials are based on the most recent Mortgage that was taken out on this home.
Original Mortgage
$89,954
Interest Rate
7.14%
Mortgage Type
Purchase Money Mortgage
Create a Home Valuation Report for This Property
The Home Valuation Report is an in-depth analysis detailing your home's value as well as a comparison with similar homes in the area
Home Values in the Area
Average Home Value in this Area
Purchase History
| Date | Buyer | Sale Price | Title Company |
|---|---|---|---|
| Cobey Edith | $133,000 | -- | |
| Joseph Malvin | $88,600 | -- |
Source: Public Records
Mortgage History
| Date | Status | Borrower | Loan Amount |
|---|---|---|---|
| Open | Joseph Malvin | $131,000 | |
| Previous Owner | Joseph Malvin | $89,954 |
Source: Public Records
Tax History
| Year | Tax Paid | Tax Assessment Tax Assessment Total Assessment is a certain percentage of the fair market value that is determined by local assessors to be the total taxable value of land and additions on the property. | Land | Improvement |
|---|---|---|---|---|
| 2025 | $4,503 | $158,270 | $46,620 | $111,650 |
| 2024 | $4,799 | $158,270 | $46,620 | $111,650 |
| 2023 | $3,399 | $101,150 | $33,950 | $67,200 |
| 2022 | $3,365 | $101,150 | $33,950 | $67,200 |
| 2021 | $3,365 | $101,150 | $33,950 | $67,200 |
| 2020 | $3,349 | $101,150 | $33,950 | $67,200 |
| 2019 | $3,275 | $101,150 | $33,950 | $67,200 |
| 2018 | $3,168 | $96,110 | $33,950 | $62,160 |
| 2017 | $3,119 | $96,110 | $33,950 | $62,160 |
| 2016 | $3,029 | $96,110 | $33,950 | $62,160 |
| 2015 | $2,972 | $96,110 | $33,950 | $62,160 |
| 2014 | $2,928 | $96,110 | $33,950 | $62,160 |
Source: Public Records
Map
Nearby Homes
Your Personal Tour Guide
Ask me questions while you tour the home.