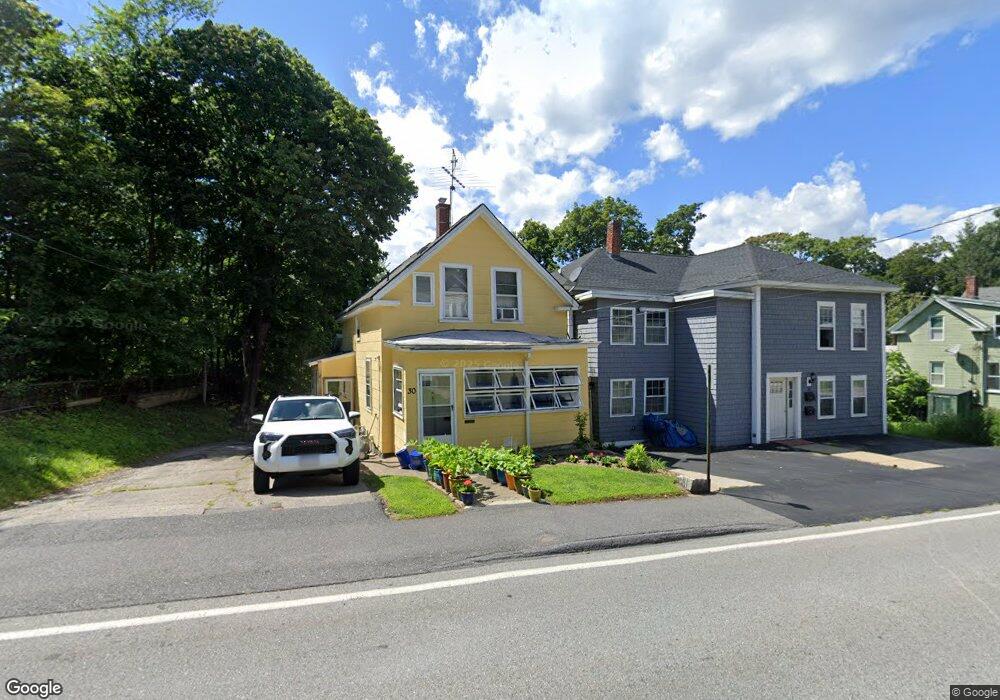
30 Manning St Hudson, MA 01749
Downtown Hudson NeighborhoodEstimated Value: $405,000 - $484,000
3
Beds
2
Baths
984
Sq Ft
$450/Sq Ft
Est. Value
About This Home
This home is located at 30 Manning St, Hudson, MA 01749 and is currently estimated at $443,203, approximately $450 per square foot. 30 Manning St is a home located in Middlesex County with nearby schools including David J. Quinn Middle School, Hudson High School, and First Steps Children's Center.
Ownership History
Date
Name
Owned For
Owner Type
Purchase Details
Closed on
Jan 11, 2011
Sold by
Milne Chris A and Fraschetti Elvira
Bought by
30 Manning St T
Current Estimated Value
Purchase Details
Closed on
Oct 21, 2010
Sold by
Parente Santino
Bought by
Fraschetti Elvira N A
Purchase Details
Closed on
Dec 15, 2009
Sold by
Fraschetti Elvira N A
Bought by
Parente Santino
Create a Home Valuation Report for This Property
The Home Valuation Report is an in-depth analysis detailing your home's value as well as a comparison with similar homes in the area
Home Values in the Area
Average Home Value in this Area
Purchase History
| Date | Buyer | Sale Price | Title Company |
|---|---|---|---|
| 30 Manning St T | $70,000 | -- | |
| Fraschetti Elvira N A | -- | -- | |
| Parente Santino | -- | -- | |
| 30 Manning St T | $70,000 | -- | |
| Fraschetti Elvira N A | -- | -- | |
| Parente Santino | -- | -- |
Source: Public Records
Tax History
| Year | Tax Paid | Tax Assessment Tax Assessment Total Assessment is a certain percentage of the fair market value that is determined by local assessors to be the total taxable value of land and additions on the property. | Land | Improvement |
|---|---|---|---|---|
| 2025 | $5,347 | $385,200 | $149,000 | $236,200 |
| 2024 | $5,047 | $360,500 | $135,400 | $225,100 |
| 2023 | $4,836 | $331,200 | $130,300 | $200,900 |
| 2022 | $4,200 | $264,800 | $118,400 | $146,400 |
| 2021 | $4,106 | $247,500 | $112,800 | $134,700 |
| 2020 | $3,850 | $231,800 | $110,600 | $121,200 |
| 2019 | $4,990 | $230,900 | $110,600 | $120,300 |
| 2018 | $5,485 | $211,200 | $105,300 | $105,900 |
| 2017 | $4,772 | $196,300 | $100,300 | $96,000 |
| 2016 | $3,332 | $192,700 | $100,300 | $92,400 |
| 2015 | $3,255 | $188,500 | $100,300 | $88,200 |
| 2014 | $3,076 | $176,600 | $87,900 | $88,700 |
Source: Public Records
Map
Nearby Homes
- 16 Barnes Blvd Unit 16
- 21 Felton St
- 11 Barracks Rd Unit 11
- 12 Barracks Rd Unit 12
- 7 Barracks Rd Unit 7
- 5 Barracks Rd Unit 5
- 10 Barracks Rd Unit 10
- 18-24 River St Unit 12
- 17 School St Unit C
- 17 School St Unit A
- 37 Tower St
- 34 Forest Ave
- 17 Mason St
- 59 Washington St
- 16 Princeton Rd
- 19 1st St
- 56 Park St
- 4 Linden St
- 2 Barracks Rd Unit 2
- 110 River St
- 30 Manning St Unit 30
- 32 Manning St
- 32 Manning St Unit 2
- 34 Manning St
- 38 Manning St
- 38 Manning St Unit 1
- 38 Manning St Unit 2
- 33 Manning St
- 40 Manning St
- 22 Manning St
- 35 Manning St
- 42 Manning St
- 39 Manning St
- 39 Manning St Unit 1
- 43 Manning St
- 18 Manning St
- 44 Manning St
- 30 High St
- 30 High St Unit 2
- 16 Manning St
Your Personal Tour Guide
Ask me questions while you tour the home.