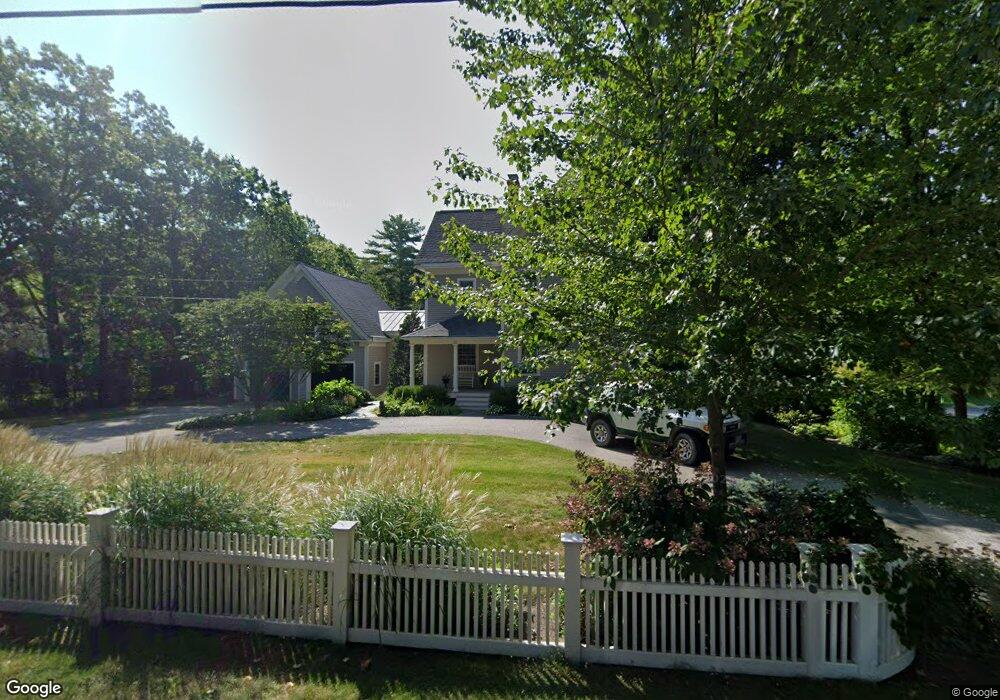
30 Maple Rd North Hampton, NH 03862
Estimated Value: $1,229,000 - $2,180,000
5
Beds
4
Baths
3,618
Sq Ft
$497/Sq Ft
Est. Value
About This Home
This home is located at 30 Maple Rd, North Hampton, NH 03862 and is currently estimated at $1,797,019, approximately $496 per square foot. 30 Maple Rd is a home with nearby schools including North Hampton School, Winnacunnet High School, and Rye Country Day School.
Ownership History
Date
Name
Owned For
Owner Type
Purchase Details
Closed on
Aug 26, 1998
Sold by
Whitney Mark and Whitney Maryanne G
Bought by
Stafford Ryan K and Stafford Deborah T
Current Estimated Value
Home Financials for this Owner
Home Financials are based on the most recent Mortgage that was taken out on this home.
Original Mortgage
$264,000
Outstanding Balance
$56,394
Interest Rate
6.9%
Estimated Equity
$1,740,625
Create a Home Valuation Report for This Property
The Home Valuation Report is an in-depth analysis detailing your home's value as well as a comparison with similar homes in the area
Home Values in the Area
Average Home Value in this Area
Purchase History
| Date | Buyer | Sale Price | Title Company |
|---|---|---|---|
| Stafford Ryan K | $330,000 | -- |
Source: Public Records
Mortgage History
| Date | Status | Borrower | Loan Amount |
|---|---|---|---|
| Open | Stafford Ryan K | $264,000 |
Source: Public Records
Tax History
| Year | Tax Paid | Tax Assessment Tax Assessment Total Assessment is a certain percentage of the fair market value that is determined by local assessors to be the total taxable value of land and additions on the property. | Land | Improvement |
|---|---|---|---|---|
| 2024 | $14,088 | $1,100,600 | $362,600 | $738,000 |
| 2023 | $13,653 | $1,096,600 | $362,600 | $734,000 |
| 2022 | $12,110 | $705,300 | $229,700 | $475,600 |
| 2021 | $11,687 | $705,300 | $229,700 | $475,600 |
| 2020 | $0 | $705,300 | $229,700 | $475,600 |
| 2019 | $11,779 | $705,300 | $229,700 | $475,600 |
| 2018 | $11,454 | $705,300 | $229,700 | $475,600 |
| 2017 | $5,792 | $575,700 | $206,100 | $369,600 |
| 2016 | $0 | $575,700 | $206,100 | $369,600 |
| 2015 | $10,063 | $575,700 | $206,100 | $369,600 |
| 2014 | $9,816 | $575,700 | $206,100 | $369,600 |
| 2013 | $9,643 | $575,700 | $206,100 | $369,600 |
Source: Public Records
Map
Nearby Homes
- 12 Runnymede Dr
- 2 Willowbrook Ave
- 193 Mill Rd
- 1 Fairway Dr
- 495 South Rd
- 78 South Rd
- 43 Ancient Hwy
- 38 Mill Rd
- 12 Smith Ave
- 61 Acorn Rd
- 30 Ancient Hwy
- 947 Ocean Blvd Unit 17
- 939 Ocean Blvd Unit 14
- 190 Kings Hwy Unit A1
- 467 High St Unit 10
- 11 Lamson Ln
- 415 High St Unit 3
- 36 Seabreeze Dr
- 53 Seabreeze Dr
- 20 Sandpiper Path
Your Personal Tour Guide
Ask me questions while you tour the home.