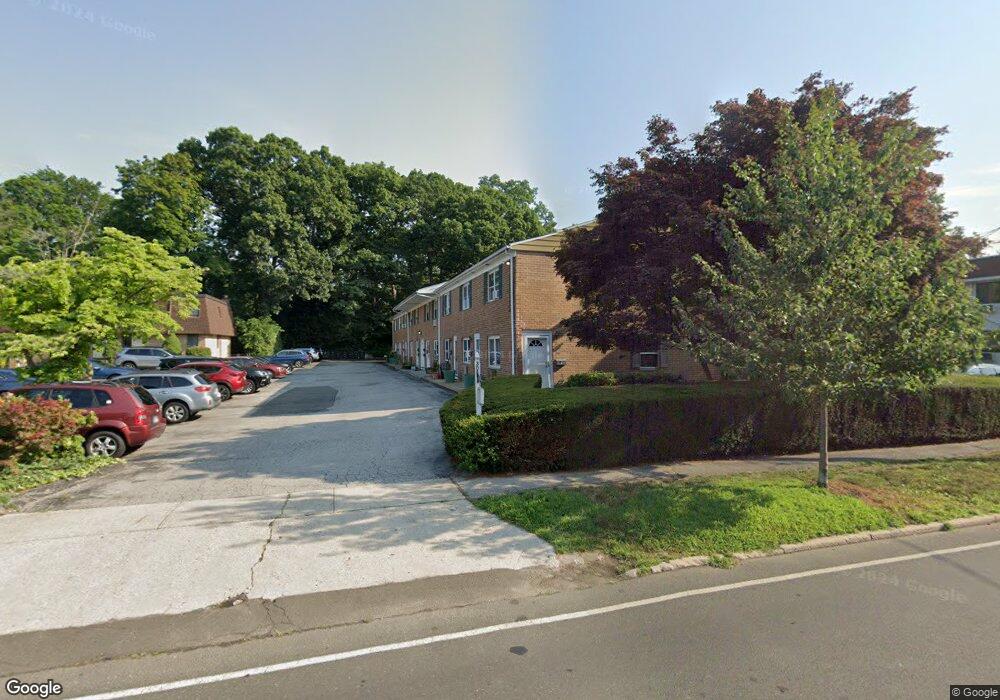
30 Maple Tree Ave Unit F Stamford, CT 06906
Glenbrook NeighborhoodEstimated Value: $320,000 - $443,000
2
Beds
1
Bath
938
Sq Ft
$391/Sq Ft
Est. Value
About This Home
This home is located at 30 Maple Tree Ave Unit F, Stamford, CT 06906 and is currently estimated at $366,954, approximately $391 per square foot. 30 Maple Tree Ave Unit F is a home located in Fairfield County with nearby schools including Julia A. Stark Elementary School, Dolan School, and Stamford High School.
Ownership History
Date
Name
Owned For
Owner Type
Purchase Details
Closed on
Mar 3, 2004
Sold by
Saunders Keith T
Bought by
Chan Chung Lee
Current Estimated Value
Purchase Details
Closed on
Jun 14, 2000
Sold by
Price Brett and Price Christine
Bought by
Saunders Keith T
Home Financials for this Owner
Home Financials are based on the most recent Mortgage that was taken out on this home.
Original Mortgage
$138,150
Interest Rate
8.13%
Purchase Details
Closed on
Jul 25, 1995
Sold by
Carswell Jeffrey A and Carswell Dawn A
Bought by
Price Brett and Price Christina
Home Financials for this Owner
Home Financials are based on the most recent Mortgage that was taken out on this home.
Original Mortgage
$85,500
Interest Rate
7.49%
Mortgage Type
Unknown
Purchase Details
Closed on
Jun 1, 1988
Sold by
Baldwin Cynthia
Bought by
Caeswell Jaffrey
Home Financials for this Owner
Home Financials are based on the most recent Mortgage that was taken out on this home.
Original Mortgage
$112,000
Interest Rate
10.24%
Create a Home Valuation Report for This Property
The Home Valuation Report is an in-depth analysis detailing your home's value as well as a comparison with similar homes in the area
Home Values in the Area
Average Home Value in this Area
Purchase History
| Date | Buyer | Sale Price | Title Company |
|---|---|---|---|
| Chan Chung Lee | $263,000 | -- | |
| Saunders Keith T | $153,000 | -- | |
| Price Brett | $95,000 | -- | |
| Caeswell Jaffrey | $140,000 | -- |
Source: Public Records
Mortgage History
| Date | Status | Borrower | Loan Amount |
|---|---|---|---|
| Previous Owner | Caeswell Jaffrey | $138,150 | |
| Previous Owner | Caeswell Jaffrey | $85,500 | |
| Previous Owner | Caeswell Jaffrey | $112,000 |
Source: Public Records
Tax History Compared to Growth
Tax History
| Year | Tax Paid | Tax Assessment Tax Assessment Total Assessment is a certain percentage of the fair market value that is determined by local assessors to be the total taxable value of land and additions on the property. | Land | Improvement |
|---|---|---|---|---|
| 2025 | $4,114 | $173,890 | $0 | $173,890 |
| 2024 | $4,024 | $173,890 | $0 | $173,890 |
| 2023 | $4,323 | $173,890 | $0 | $173,890 |
| 2022 | $4,140 | $154,830 | $0 | $154,830 |
| 2021 | $4,095 | $154,830 | $0 | $154,830 |
| 2020 | $3,990 | $154,830 | $0 | $154,830 |
| 2019 | $3,990 | $154,830 | $0 | $154,830 |
| 2018 | $3,843 | $154,830 | $0 | $154,830 |
| 2017 | $3,571 | $137,330 | $0 | $137,330 |
| 2016 | $3,470 | $137,330 | $0 | $137,330 |
| 2015 | $3,380 | $137,330 | $0 | $137,330 |
| 2014 | $3,267 | $137,330 | $0 | $137,330 |
Source: Public Records
Map
Nearby Homes
- 30 Maple Tree Ave Unit D
- 35 Maple Tree Ave Unit 6
- 69 Maple Tree Ave Unit 4
- 406 Courtland Ave Unit D
- 88 Maple Tree Ave Unit G
- 30 Lenox Ave
- 34 Crescent St Unit 2D
- 43 Crescent St Unit 11
- 415 West Ave
- 596 Glenbrook Rd Unit 36
- 98 Holmes Ave
- 90 Courtland Hill St
- 8 Windell Place
- 151 Courtland Ave Unit 6
- 151 Courtland Ave Unit 4
- 30 Lake Dr
- 51 Glendale Rd
- 333 West Ave Unit 3
- 88 Pine Hill Ave
- 75 Courtland Ave Unit 10
- 30 Maple Tree Ave Unit A
- 30 Maple Tree Ave Unit B
- 30 Maple Tree Ave Unit C
- 30 Maple Tree Ave Unit E
- 30 Maple Tree Ave Unit G
- 30 Maple Tree Ave Unit H
- 30 Maple Tree Ave Unit I
- 30 Maple Tree Ave Unit J
- 30 Maple Tree Ave Unit 2D
- 30 Maple Tree Ave Unit F1
- 30 Maple Tree Ave Unit B1
- 30 Maple Tree Ave Unit G1
- 38 Maple Tree Ave Unit 7
- 38 Maple Tree Ave Unit 6
- 38 Maple Tree Ave Unit 5
- 38 Maple Tree Ave Unit 4
- 38 Maple Tree Ave Unit 3
- 38 Maple Tree Ave Unit 2
- 38 Maple Tree Ave Unit 1
- 38 Maple Tree Ave