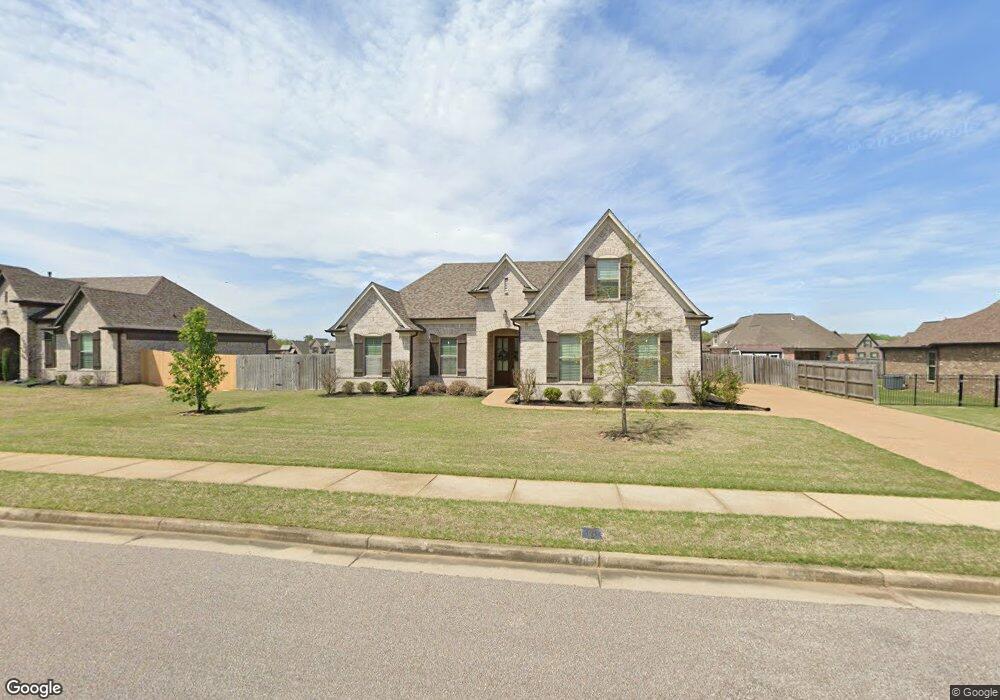
30 Misty Woods Cove Oakland, TN 38060
Estimated Value: $352,923 - $378,000
--
Bed
--
Bath
1,777
Sq Ft
$205/Sq Ft
Est. Value
About This Home
This home is located at 30 Misty Woods Cove, Oakland, TN 38060 and is currently estimated at $363,731, approximately $204 per square foot. 30 Misty Woods Cove is a home with nearby schools including Oakland Elementary School, West Junior High School, and Fayette Ware Comprehensive High School.
Ownership History
Date
Name
Owned For
Owner Type
Purchase Details
Closed on
Sep 13, 2021
Sold by
Dunn Logan T and Dunn Taylor
Bought by
Price Howard G and Price Mary D
Current Estimated Value
Home Financials for this Owner
Home Financials are based on the most recent Mortgage that was taken out on this home.
Original Mortgage
$250,000
Outstanding Balance
$227,142
Interest Rate
2.7%
Mortgage Type
New Conventional
Estimated Equity
$136,589
Purchase Details
Closed on
Aug 21, 2017
Sold by
Regency Homebuilders Llc
Bought by
Taylor Cook and Dunn Logan T
Home Financials for this Owner
Home Financials are based on the most recent Mortgage that was taken out on this home.
Original Mortgage
$211,900
Interest Rate
4.03%
Mortgage Type
New Conventional
Purchase Details
Closed on
Jun 6, 2016
Sold by
Bank Of Bartlett
Bought by
Regency Homebuilders Llc
Create a Home Valuation Report for This Property
The Home Valuation Report is an in-depth analysis detailing your home's value as well as a comparison with similar homes in the area
Home Values in the Area
Average Home Value in this Area
Purchase History
| Date | Buyer | Sale Price | Title Company |
|---|---|---|---|
| Price Howard G | $335,000 | Realty Title & Escrow | |
| Taylor Cook | $243,400 | -- | |
| Cook Taylor | $243,419 | None Available | |
| Regency Homebuilders Llc | $770,000 | -- |
Source: Public Records
Mortgage History
| Date | Status | Borrower | Loan Amount |
|---|---|---|---|
| Open | Price Howard G | $250,000 | |
| Previous Owner | Cook Taylor | $211,900 |
Source: Public Records
Tax History Compared to Growth
Tax History
| Year | Tax Paid | Tax Assessment Tax Assessment Total Assessment is a certain percentage of the fair market value that is determined by local assessors to be the total taxable value of land and additions on the property. | Land | Improvement |
|---|---|---|---|---|
| 2024 | $1,604 | $62,075 | $10,000 | $52,075 |
| 2023 | $1,604 | $62,075 | $0 | $0 |
| 2022 | $1,063 | $62,075 | $10,000 | $52,075 |
| 2021 | $1,063 | $62,075 | $10,000 | $52,075 |
| 2020 | $822 | $62,075 | $10,000 | $52,075 |
| 2019 | $1,106 | $54,500 | $8,750 | $45,750 |
| 2018 | $1,138 | $54,500 | $8,750 | $45,750 |
| 2017 | $156 | $54,500 | $8,750 | $45,750 |
| 2016 | $142 | $7,500 | $7,500 | $0 |
| 2015 | $143 | $7,500 | $7,500 | $0 |
| 2014 | $143 | $7,500 | $7,500 | $0 |
Source: Public Records
Map
Nearby Homes
- 180 Oak Hollow Dr
- 25 Aspen Wood Cove
- 205 Oak Hollow Dr
- 40 Burr Oak Cove
- 230 Oak Hollow Dr
- 80 Shady Pines Cove
- 245 Oak Hollow Dr
- 255 Oak Hollow Dr
- 250 Oak Hollow Dr
- 85 Burr Oak Cove
- 145 Misty Meadow Ln
- 245 Oaks Edge
- 115 Norma Carol Cove
- 25 Oak Springs Cove
- Bristol Bonus Plan at Riverwood Gardens
- Clifton Bonus Plan at Riverwood Gardens
- DOVER Plan at Riverwood Gardens
- CAIRN Plan at Riverwood Gardens
- CAMERON Plan at Riverwood Gardens
- CLIFTON Plan at Riverwood Gardens
- 25 Misty Woods Cove
- 35 Misty Woods Cove
- 10 Misty Woods Cove
- 15 Misty Woods Cove
- 135 Oak Hollow Dr
- 125 Oak Hollow Dr
- 60 Misty Woods Cove
- 145 Oak Hollow Dr
- 10 Misty Birch Ln Unit Lot 199
- 20 Misty Birch Ln Unit Lot 200
- 50 Misty Birch Ln
- 50 Misty Woods Cove
- 55 Misty Woods Cove
- 115 Oak Hollow Dr
- 60 Misty Birch Ln
- 155 Oak Hollow Dr
- 70 Misty Birch Ln
- 80 Misty Birch Ln
- 40 Misty Birch Ln
- 95 Misty Birch Ln