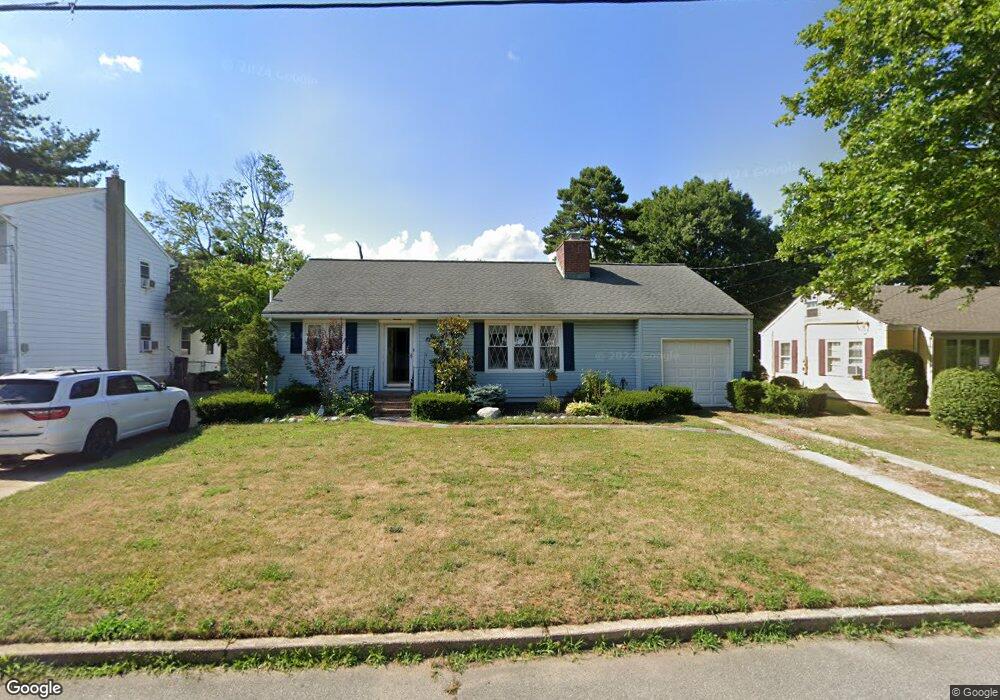
30 Monroe St Keyport, NJ 07735
Estimated Value: $518,000 - $596,000
2
Beds
2
Baths
1,467
Sq Ft
$386/Sq Ft
Est. Value
About This Home
This home is located at 30 Monroe St, Keyport, NJ 07735 and is currently estimated at $566,746, approximately $386 per square foot. 30 Monroe St is a home located in Monmouth County with nearby schools including Keyport Central School, Keyport High School, and Icob Academy.
Ownership History
Date
Name
Owned For
Owner Type
Purchase Details
Closed on
Jun 15, 2005
Sold by
Sonja I Wilhwlm By Helene Ange
Bought by
Galli Jesse and Clausi Catherine
Current Estimated Value
Home Financials for this Owner
Home Financials are based on the most recent Mortgage that was taken out on this home.
Original Mortgage
$251,920
Outstanding Balance
$116,363
Interest Rate
4%
Mortgage Type
Adjustable Rate Mortgage/ARM
Estimated Equity
$450,383
Create a Home Valuation Report for This Property
The Home Valuation Report is an in-depth analysis detailing your home's value as well as a comparison with similar homes in the area
Home Values in the Area
Average Home Value in this Area
Purchase History
| Date | Buyer | Sale Price | Title Company |
|---|---|---|---|
| Galli Jesse | $314,900 | -- |
Source: Public Records
Mortgage History
| Date | Status | Borrower | Loan Amount |
|---|---|---|---|
| Open | Galli Jesse | $251,920 |
Source: Public Records
Tax History Compared to Growth
Tax History
| Year | Tax Paid | Tax Assessment Tax Assessment Total Assessment is a certain percentage of the fair market value that is determined by local assessors to be the total taxable value of land and additions on the property. | Land | Improvement |
|---|---|---|---|---|
| 2025 | $9,358 | $495,800 | $237,000 | $258,800 |
| 2024 | $9,225 | $452,100 | $206,100 | $246,000 |
| 2023 | $9,225 | $419,700 | $187,400 | $232,300 |
| 2022 | $7,655 | $364,800 | $162,900 | $201,900 |
| 2021 | $7,655 | $303,300 | $150,900 | $152,400 |
| 2020 | $7,387 | $290,500 | $145,600 | $144,900 |
| 2019 | $7,165 | $282,200 | $140,600 | $141,600 |
| 2018 | $7,231 | $278,100 | $145,600 | $132,500 |
| 2017 | $7,075 | $271,400 | $140,600 | $130,800 |
| 2016 | $6,845 | $264,800 | $140,600 | $124,200 |
| 2015 | $6,446 | $248,200 | $125,600 | $122,600 |
| 2014 | $6,283 | $244,300 | $100,600 | $143,700 |
Source: Public Records
Map
Nearby Homes
- 50 State Route 36
- 231 Atlantic St Unit 23
- 25-27 Brook Ave
- 195 Atlantic St
- 2108 Florence Ave
- 90 Saint Peters Place
- 72 Manchester Ave
- 226 Osborn St
- 9 Monmouth Place
- 69 Maple Place
- 118 Village Green Way
- 3 Julia Ln
- 3 Oyster Creek Dr
- 49 Pine Creek Village
- 563 Holmdel Rd
- 162 2nd St
- 160 Village Green Way
- 73 2nd St
- 142 2nd St
- 40 Church St