30 Morross Cir Unit 44 Dearborn, MI 48126
Aviation NeighborhoodEstimated payment $218/month
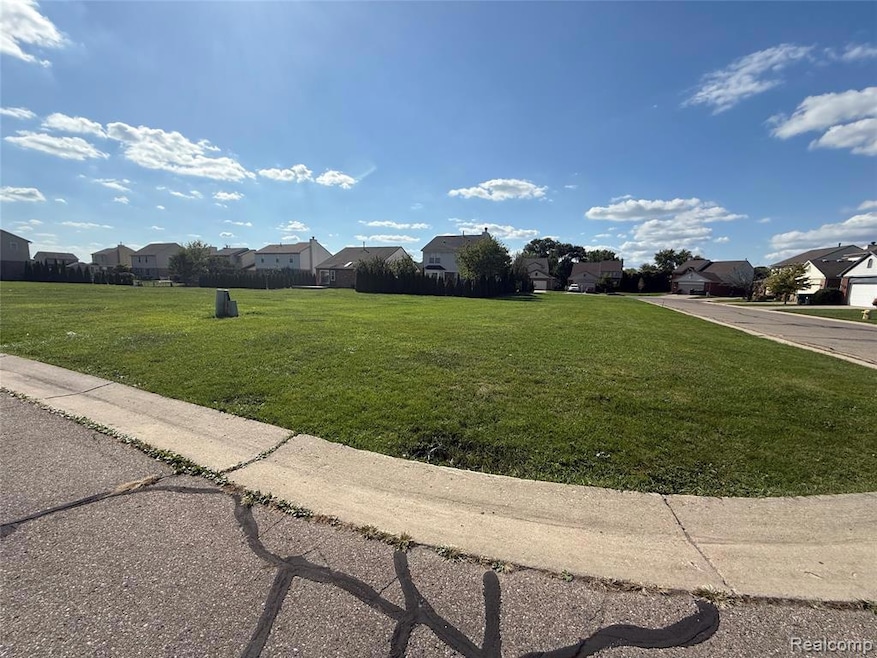
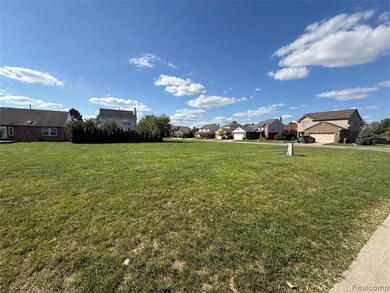
About This Lot
This home is located at 30 Morross Cir Unit 44, Dearborn, MI 48126 and is currently priced at $29,900. 30 Morross Cir Unit 44 is a home located in Wayne County with nearby schools including McDonald Elementary School, McCollough-Unis School, and Fordson High School.

Property Details
Property Type
- Land
Est. Annual Taxes
Lot Details
- 6,098 Sq Ft Lot
- Lot Dimensions are 87x94
Community Details
- Wayne County Condo Sub Plan 543 Subdivision
Listing and Financial Details
- Assessor Parcel Number 32821004304112
Map
Home Values in the Area
Average Home Value in this Area
Tax History
| Year | Tax Paid | Tax Assessment Tax Assessment Total Assessment is a certain percentage of the fair market value that is determined by local assessors to be the total taxable value of land and additions on the property. | Land | Improvement |
|---|---|---|---|---|
| 2025 | $647 | $10,300 | $0 | $0 |
| 2024 | $647 | $17,800 | $0 | $0 |
| 2023 | $576 | $10,000 | $0 | $0 |
| 2022 | $696 | $10,000 | $0 | $0 |
| 2021 | $803 | $10,900 | $0 | $0 |
| 2019 | $881 | $10,000 | $0 | $0 |
| 2018 | $667 | $10,000 | $0 | $0 |
| 2017 | $200 | $12,500 | $0 | $0 |
| 2016 | $975 | $15,000 | $0 | $0 |
| 2015 | $1,620 | $16,200 | $0 | $0 |
| 2013 | $1,620 | $16,200 | $0 | $0 |
| 2011 | -- | $16,200 | $0 | $0 |
Property History
| Date | Event | Price | List to Sale | Price per Sq Ft |
|---|---|---|---|---|
| 09/22/2025 09/22/25 | For Sale | $29,900 | -- | -- |
Purchase History
| Date | Type | Sale Price | Title Company |
|---|---|---|---|
| Quit Claim Deed | $10,000 | None Available | |
| Quit Claim Deed | $10,000 | None Available | |
| Quit Claim Deed | $12,000 | None Available | |
| Interfamily Deed Transfer | -- | None Available | |
| Quit Claim Deed | -- | None Available | |
| Interfamily Deed Transfer | -- | None Available | |
| Quit Claim Deed | -- | None Available | |
| Quit Claim Deed | $1,700 | None Available | |
| Sheriffs Deed | $1,333 | None Available |
Source: Realcomp
MLS Number: 20251038940
APN: 32-10-043-04-112
Disclaimer: Certain information contained herein is derived from information provided by parties other than Homes.com. All information provided is deemed reliable, but is not guaranteed to be accurate and should be independently verified.
![]() IDX provided courtesy of Realcomp II Ltd. via Ten-X and MLS
IDX provided courtesy of Realcomp II Ltd. via Ten-X and MLS
Copyright 2025 Realcomp II Ltd. Shareholders
IDX information is provided exclusively for consumers' personal, noncommercial use and may not be used for any purpose other than to identify prospective properties consumers may be interested in purchasing. The accuracy of all information, regardless of source, is not guaranteed or warranted. All information should be independently verified.
Listing Information presented by local MLS brokerage: Ten-X, local REALTOR®- Arlene Richardson - (888)-952-6393
- 52 Morross Cir Unit 42
- 39 Morross Cir Unit 15
- 55 Morross Cir Unit 7
- 8088 Wisconsin St
- 8114 Roselawn St
- 8131 Greenlawn St
- 8100 Greenlawn St
- 7841 Wyoming St
- 8248 Roselawn St
- 8116 Wyoming Ave
- 8294 Northlawn St
- 8245 Greenlawn St
- 8010 Normile St
- 8301 Northlawn St
- 8306 Wisconsin St
- 7929 Normile St
- 7642 Normile St
- 8265 Kentucky St
- 8335 Wisconsin St
- 8342 Roselawn St
- 8248 Roselawn Unit 2 St
- 8248 Roselawn St
- 8606 Cloverlawn Ave
- 10071 Joy Rd
- 10071 Joy Rd Unit 3
- 7100 Freda St
- 8035 Pinehurst St
- 6734 Clifton St
- 5933 Ogden St
- 6185 Livernois Ave
- 6534 Appoline St
- 9228 Steel St
- 10343 Crocuslawn Ave
- 8921 Cheyenne St
- 8284 Schaefer Hwy
- 8288 Schaefer Hwy
- 9264 Ward Ave
- 9262 Ward Ave Unit 9264
- 5393 Seebaldt St Unit A
- 5029 Dailey St