30 Murval Rd Pocasset, MA 2559
Pocasset NeighborhoodEstimated Value: $660,000 - $912,000
2
Beds
1
Bath
1,528
Sq Ft
$511/Sq Ft
Est. Value
About This Home
This home is located at 30 Murval Rd, Pocasset, MA 2559 and is currently estimated at $781,487, approximately $511 per square foot. 30 Murval Rd is a home located in Barnstable County with nearby schools including Bourne High School and Cadence Academy Preschool - Bourne.
Ownership History
Date
Name
Owned For
Owner Type
Purchase Details
Closed on
Sep 17, 2024
Sold by
Baines David E
Bought by
Baines Rt and Baines
Current Estimated Value
Purchase Details
Closed on
Nov 18, 2005
Sold by
Gordon Joseph D
Bought by
Baines David E
Home Financials for this Owner
Home Financials are based on the most recent Mortgage that was taken out on this home.
Original Mortgage
$175,000
Interest Rate
6.07%
Mortgage Type
Purchase Money Mortgage
Create a Home Valuation Report for This Property
The Home Valuation Report is an in-depth analysis detailing your home's value as well as a comparison with similar homes in the area
Home Values in the Area
Average Home Value in this Area
Purchase History
| Date | Buyer | Sale Price | Title Company |
|---|---|---|---|
| Baines Rt | -- | None Available | |
| Baines Rt | -- | None Available | |
| Baines Rt | -- | None Available | |
| Baines David E | $525,000 | -- | |
| Baines David E | $525,000 | -- |
Source: Public Records
Mortgage History
| Date | Status | Borrower | Loan Amount |
|---|---|---|---|
| Previous Owner | Baines David E | $80,000 | |
| Previous Owner | Baines David E | $175,000 |
Source: Public Records
Tax History Compared to Growth
Tax History
| Year | Tax Paid | Tax Assessment Tax Assessment Total Assessment is a certain percentage of the fair market value that is determined by local assessors to be the total taxable value of land and additions on the property. | Land | Improvement |
|---|---|---|---|---|
| 2025 | $6,176 | $790,800 | $570,700 | $220,100 |
| 2024 | $5,968 | $744,200 | $543,500 | $200,700 |
| 2023 | $5,298 | $601,400 | $423,300 | $178,100 |
| 2022 | $4,785 | $474,200 | $332,000 | $142,200 |
| 2021 | $20,330 | $432,100 | $302,200 | $129,900 |
| 2020 | $4,539 | $422,600 | $299,300 | $123,300 |
| 2019 | $20,890 | $416,000 | $299,300 | $116,700 |
| 2018 | $4,200 | $398,500 | $292,400 | $106,100 |
| 2017 | $4,363 | $423,600 | $318,600 | $105,000 |
| 2016 | $3,836 | $377,600 | $289,600 | $88,000 |
| 2015 | $3,802 | $377,600 | $289,600 | $88,000 |
Source: Public Records
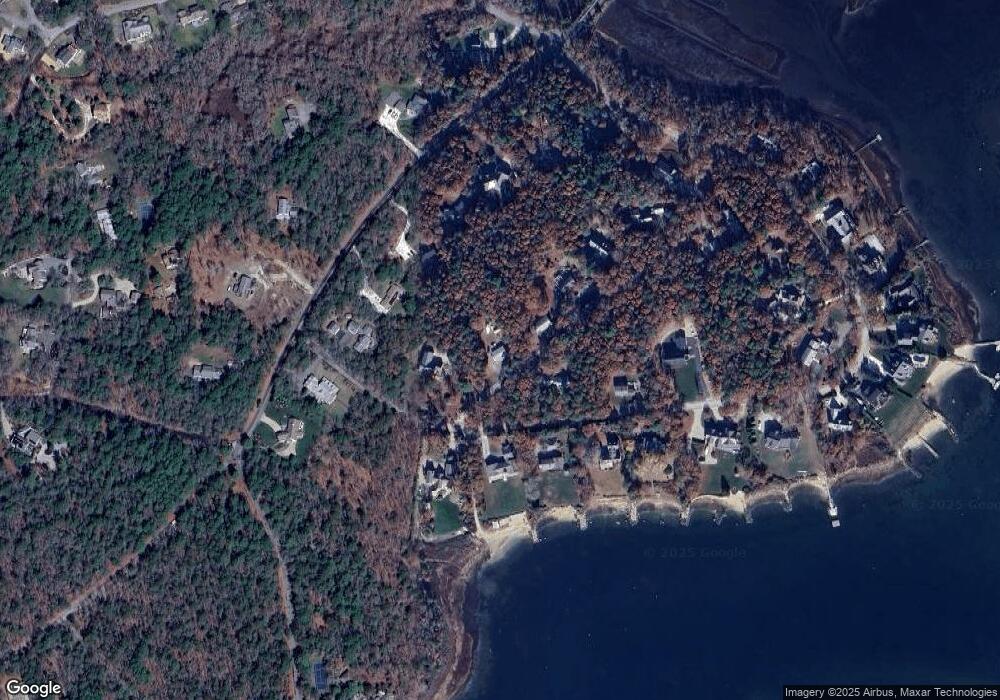
Map
Nearby Homes