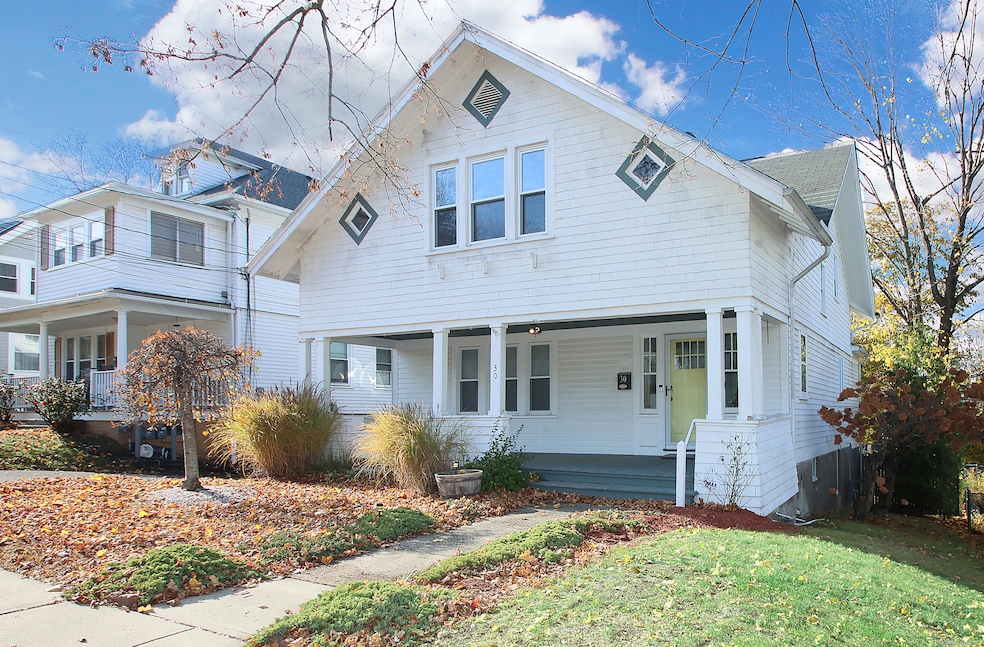


30 Pearl St Meriden, CT 06450
Estimated payment $2,199/month
Highlights
- Colonial Architecture
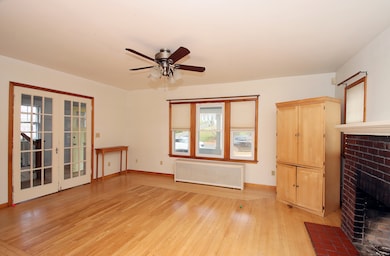
- 1 Fireplace
- Ceiling Fan
- Attic
- Hot Water Circulator
- 3-minute walk to Meriden Park Department
About This Home
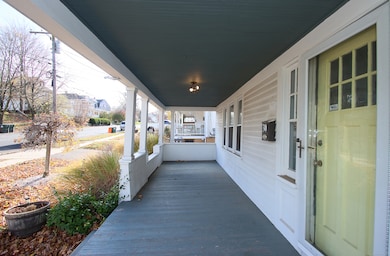
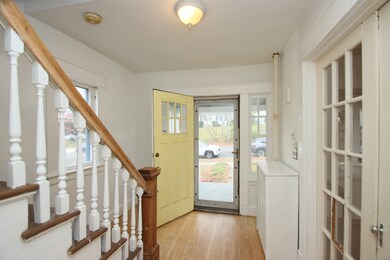
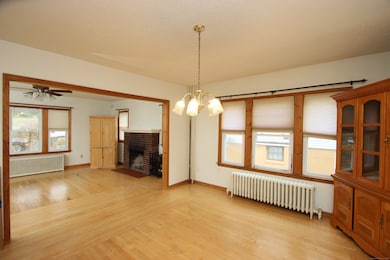
Centrally located near major amenities and transportation, this spacious three bedroom, one and one-half bath home offers exceptional comfort and functionality. The inviting front yard features charming flower beds for gardening enthusiasts and a wide covered porch great for relaxing. Inside, you'll find gleaming hardwood floors, high ceilings, and an open floor plan accented by French doors, a brick fireplace, and abundant natural light. The kitchen is well-equipped with ample cabinetry, generous counter space, a breakfast bar, dishwasher, and garbage disposal. A convenient powder room doubles as a laundry area. Upstairs, three generously sized bedrooms boast oversized closets for exceptional storage. The finished basement includes a large entertainment space with a built-in bar. Outdoors, enjoy an expansive deck, a fenced yard, and plenty of off-street parking. A standout feature is the oversized detached garage with two bay doors, an office, and its own gas furnace and electricity-ideal for business owners or entrepreneurs seeking a versatile workspace.
Listing Agent
Coldwell Banker Realty Brokerage Phone: (203) 520-9052 License #RES.0820897 Listed on: 11/20/2025

Home Details
Home Type
- Single Family
Est. Annual Taxes
- $6,257
Year Built
- Built in 1920
Lot Details
- 0.32 Acre Lot
- Level Lot
- Property is zoned R-2
Parking
- 2 Car Garage
Home Design
- Colonial Architecture
- Block Foundation
- Frame Construction
- Asphalt Shingled Roof
- Shake Siding
Interior Spaces
- 1,701 Sq Ft Home
- Ceiling Fan
- 1 Fireplace
- Basement Fills Entire Space Under The House
- Attic or Crawl Hatchway Insulated
Kitchen
- Oven or Range
- Microwave
- Dishwasher
- Disposal
Bedrooms and Bathrooms
- 3 Bedrooms
Laundry
- Dryer
- Washer
Utilities
- Hot Water Heating System
- Heating System Uses Natural Gas
- Hot Water Circulator
Listing and Financial Details
- Assessor Parcel Number 1166418
Map
Home Values in the Area
Average Home Value in this Area
Tax History
| Year | Tax Paid | Tax Assessment Tax Assessment Total Assessment is a certain percentage of the fair market value that is determined by local assessors to be the total taxable value of land and additions on the property. | Land | Improvement |
|---|---|---|---|---|
| 2025 | $6,257 | $165,060 | $63,980 | $101,080 |
| 2024 | $6,356 | $165,060 | $63,980 | $101,080 |
| 2023 | $6,127 | $165,060 | $63,980 | $101,080 |
| 2022 | $5,780 | $165,060 | $63,980 | $101,080 |
| 2021 | $5,342 | $122,710 | $63,350 | $59,360 |
| 2020 | $5,327 | $122,710 | $63,350 | $59,360 |
| 2019 | $5,281 | $122,710 | $63,350 | $59,360 |
| 2018 | $5,302 | $122,710 | $63,350 | $59,360 |
| 2017 | $5,161 | $122,710 | $63,350 | $59,360 |
| 2016 | $5,007 | $129,150 | $55,650 | $73,500 |
| 2015 | $5,007 | $129,150 | $55,650 | $73,500 |
| 2014 | $4,886 | $129,150 | $55,650 | $73,500 |
Property History
| Date | Event | Price | List to Sale | Price per Sq Ft |
|---|---|---|---|---|
| 11/20/2025 11/20/25 | For Sale | $320,000 | -- | $188 / Sq Ft |
Purchase History
| Date | Type | Sale Price | Title Company |
|---|---|---|---|
| Warranty Deed | $210,000 | -- | |
| Warranty Deed | $210,000 | -- |
Mortgage History
| Date | Status | Loan Amount | Loan Type |
|---|---|---|---|
| Open | $198,539 | Stand Alone Refi Refinance Of Original Loan | |
| Closed | $199,500 | No Value Available | |
| Previous Owner | $168,000 | No Value Available |
Source: SmartMLS
MLS Number: 24118724
APN: MERI-000209-000100-000026-000027
Disclaimer: Certain information contained herein is derived from information provided by parties other than Homes.com. All information provided is deemed reliable, but is not guaranteed to be accurate and should be independently verified.
![]() IDX information is provided exclusively for personal, non-commercial use, and may not be used for any purpose other than to identify prospective properties consumers may be interested in purchasing. Information is deemed reliable but not guaranteed.
IDX information is provided exclusively for personal, non-commercial use, and may not be used for any purpose other than to identify prospective properties consumers may be interested in purchasing. Information is deemed reliable but not guaranteed.
- 28 Orient St
- 51 Hillcrest Terrace
- 69 Sterling Village Unit 69
- 212 Sterling Village Unit 212
- 43 N Pearl St
- 111 Sunset Ave Unit 111, 113, 115
- 515 Liberty St Unit 515
- 80 Dryden Dr
- 272 Murray St
- 56 Gravel St
- 18 Hobart St
- 24 Hobart St
- 201 Lydale Place
- 158 Swain Ave
- 301 Wall St
- 112 Hobart St
- 760 Broad St
- 47 Margerie St
- 85 Milici Cir
- 158 Paddock Ave Unit 1203
- 410 E Main St
- 570 Broad St
- 122 Charles St
- 75 Curtis St Unit 2
- 85 Twiss St
- 264 Broad St Unit 3
- 71 Catlin St
- 464 Pratt Street Extension Unit 303
- 113 E Main St Unit 5
- 16 Prince St
- 74 Park St
- 204 Broad St Unit 3
- 366 Bee St
- 135 Willow St
- 135 Willow St
- 135 Willow St
- 135 Willow St
- 161 State St
- 406 Bee St
- 390 Bee St