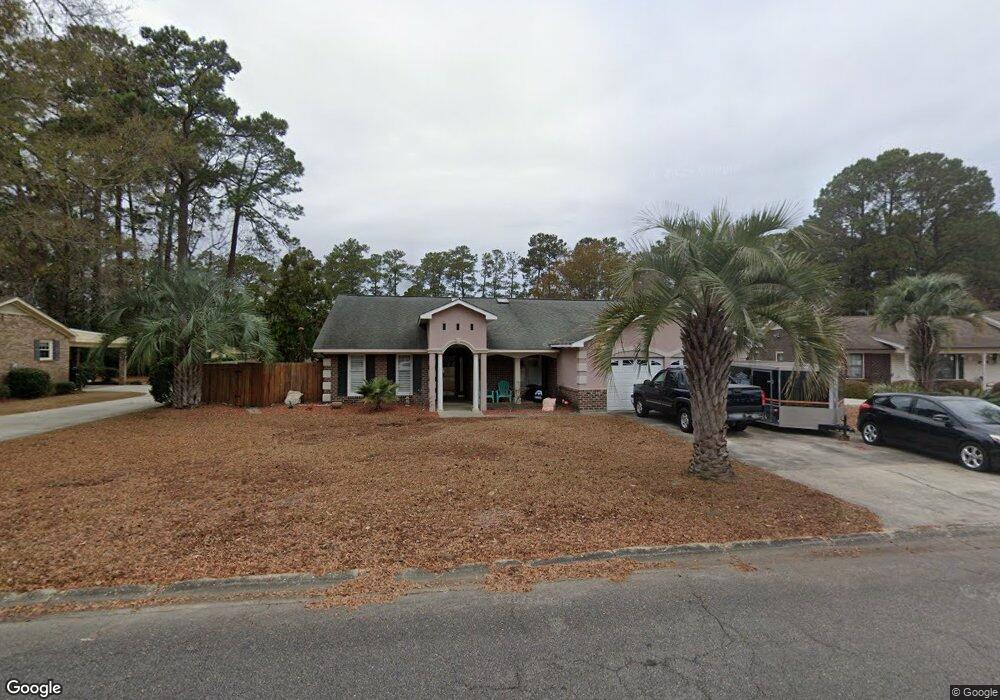
30 Plantation Rd Myrtle Beach, SC 29588
Estimated Value: $311,000 - $431,000
3
Beds
3
Baths
1,639
Sq Ft
$212/Sq Ft
Est. Value
About This Home
This home is located at 30 Plantation Rd, Myrtle Beach, SC 29588 and is currently estimated at $347,089, approximately $211 per square foot. 30 Plantation Rd is a home located in Horry County with nearby schools including Socastee Elementary School, Forestbrook Middle School, and Socastee High School.
Ownership History
Date
Name
Owned For
Owner Type
Purchase Details
Closed on
Nov 26, 2019
Sold by
Curry David P
Bought by
Mills Donald E Madden
Current Estimated Value
Home Financials for this Owner
Home Financials are based on the most recent Mortgage that was taken out on this home.
Original Mortgage
$159,500
Outstanding Balance
$139,924
Interest Rate
3.7%
Estimated Equity
$207,165
Purchase Details
Closed on
Oct 31, 2019
Sold by
Palmetto Recon Development
Bought by
Curry David P
Home Financials for this Owner
Home Financials are based on the most recent Mortgage that was taken out on this home.
Original Mortgage
$159,500
Outstanding Balance
$139,924
Interest Rate
3.7%
Estimated Equity
$207,165
Purchase Details
Closed on
Mar 4, 2019
Sold by
Bischoff Noah H
Bought by
Palmetto Recon Development
Purchase Details
Closed on
May 4, 2018
Sold by
Olsen Eugene A
Bought by
Bischoff Noah H
Purchase Details
Closed on
May 28, 2002
Sold by
Olsen Eleanor M
Bought by
Olsen Eugene A
Create a Home Valuation Report for This Property
The Home Valuation Report is an in-depth analysis detailing your home's value as well as a comparison with similar homes in the area
Home Values in the Area
Average Home Value in this Area
Purchase History
| Date | Buyer | Sale Price | Title Company |
|---|---|---|---|
| Mills Donald E Madden | $220,000 | -- | |
| Curry David P | -- | -- | |
| Palmetto Recon Development | $35,000 | -- | |
| Bischoff Noah H | $20,000 | -- | |
| Olsen Eugene A | $55,287 | -- |
Source: Public Records
Mortgage History
| Date | Status | Borrower | Loan Amount |
|---|---|---|---|
| Open | Mills Donald E Madden | $159,500 |
Source: Public Records
Tax History Compared to Growth
Tax History
| Year | Tax Paid | Tax Assessment Tax Assessment Total Assessment is a certain percentage of the fair market value that is determined by local assessors to be the total taxable value of land and additions on the property. | Land | Improvement |
|---|---|---|---|---|
| 2024 | $1,010 | $14,154 | $4,305 | $9,849 |
| 2023 | $1,010 | $8,710 | $1,198 | $7,512 |
| 2021 | $913 | $8,710 | $1,198 | $7,512 |
| 2020 | $2,725 | $8,710 | $1,198 | $7,512 |
| 2019 | $1,925 | $9,165 | $1,797 | $7,368 |
| 2018 | $180 | $2,269 | $1,747 | $522 |
| 2017 | $396 | $4,093 | $1,165 | $2,928 |
| 2016 | -- | $4,093 | $1,165 | $2,928 |
| 2015 | $403 | $4,093 | $1,165 | $2,928 |
| 2014 | $374 | $4,093 | $1,165 | $2,928 |
Source: Public Records
Map
Nearby Homes
- 2 Sioux Trail
- 4 Plantation Rd
- 71 Plantation Rd
- 102 Plantation Rd
- 5724 Dogwood Cir
- 209 Stonebrook Dr
- 389 Cattle Drive Cir
- 2397 River Rd
- 1017 Shem Creek Cir Unit Bridge Creek
- 5867 Rosewood Dr
- 489 Wallingford Cir
- 5730 Highway 707 Unit Lot 58
- 215 Tibton Cir
- 209 Foxpath Loop
- 3777 Ed Smith Ave
- 424 Wallingford Cir
- 3721 Ed Smith Ave
- 144 Kenzgar Dr
- 305 Foxpath Loop
- 313 Foxpath Loop
- 30 Plantation Rd
- 32 Plantation Rd
- 28 Plantation Rd
- 28 Plantation Rd
- 105 Cimerron Dr
- 103 Cimerron Dr
- 26 Plantation Rd
- 26 Plantation Rd
- 107 Cimerron Dr
- 26 Plantation Rd
- 23 Plantation Rd
- 34 Plantation Rd
- 23 Plantation Rd
- 21 Plantation Rd
- 101 Cimerron Dr
- 101 Cimerron Dr Unit A
- 25 Plantation Rd
- 109 Cimerron Dr
- 24 Plantation Rd Unit 24 Plantation Road
- 24 Plantation Rd