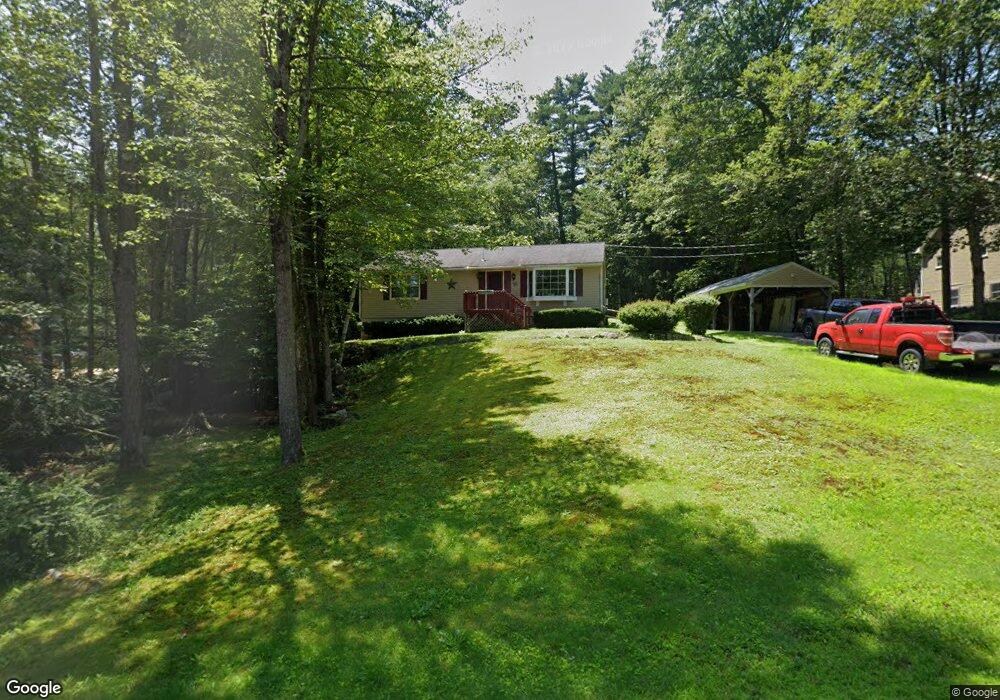
30 Red Gate Ln Meredith, NH 03253
Estimated Value: $413,000 - $745,000
2
Beds
2
Baths
1,232
Sq Ft
$471/Sq Ft
Est. Value
About This Home
This home is located at 30 Red Gate Ln, Meredith, NH 03253 and is currently estimated at $580,579, approximately $471 per square foot. 30 Red Gate Ln is a home located in Belknap County with nearby schools including Inter-Lakes Elementary School, Sandwich Central School, and Inter-Lakes Middle High School.
Ownership History
Date
Name
Owned For
Owner Type
Purchase Details
Closed on
Oct 3, 2005
Sold by
Muller Fam T
Bought by
Woodaman John J
Current Estimated Value
Home Financials for this Owner
Home Financials are based on the most recent Mortgage that was taken out on this home.
Original Mortgage
$143,000
Outstanding Balance
$31,119
Interest Rate
5.84%
Mortgage Type
Purchase Money Mortgage
Estimated Equity
$549,460
Purchase Details
Closed on
Nov 10, 1998
Sold by
Hall Est Leona P
Bought by
Muller Fam 1997 T
Home Financials for this Owner
Home Financials are based on the most recent Mortgage that was taken out on this home.
Original Mortgage
$12,000
Interest Rate
6.64%
Mortgage Type
Purchase Money Mortgage
Create a Home Valuation Report for This Property
The Home Valuation Report is an in-depth analysis detailing your home's value as well as a comparison with similar homes in the area
Home Values in the Area
Average Home Value in this Area
Purchase History
| Date | Buyer | Sale Price | Title Company |
|---|---|---|---|
| Woodaman John J | $179,000 | -- | |
| Muller Fam 1997 T | $80,000 | -- |
Source: Public Records
Mortgage History
| Date | Status | Borrower | Loan Amount |
|---|---|---|---|
| Open | Woodaman John J | $143,000 | |
| Previous Owner | Muller Fam 1997 T | $12,000 |
Source: Public Records
Tax History
| Year | Tax Paid | Tax Assessment Tax Assessment Total Assessment is a certain percentage of the fair market value that is determined by local assessors to be the total taxable value of land and additions on the property. | Land | Improvement |
|---|---|---|---|---|
| 2024 | $3,543 | $345,300 | $175,500 | $169,800 |
| 2023 | $3,415 | $345,300 | $175,500 | $169,800 |
| 2022 | $3,182 | $227,800 | $94,300 | $133,500 |
| 2021 | $3,059 | $227,800 | $94,300 | $133,500 |
| 2020 | $12,292 | $227,800 | $94,300 | $133,500 |
| 2019 | $2,881 | $181,300 | $59,900 | $121,400 |
| 2018 | $2,832 | $181,300 | $59,900 | $121,400 |
| 2016 | $2,850 | $182,800 | $71,600 | $111,200 |
| 2015 | $2,779 | $182,800 | $71,600 | $111,200 |
| 2014 | $2,711 | $182,800 | $71,600 | $111,200 |
| 2013 | $2,621 | $181,900 | $71,600 | $110,300 |
Source: Public Records
Map
Nearby Homes
- 2 Waukewan Ave
- 27 Stevens Ave Unit D
- 21 Upper Ladd Hill Rd Unit D
- 21 Upper Ladd Hill Rd Unit A
- 21 Upper Ladd Hill Rd Unit E
- 21 Upper Ladd Hill Rd Unit C
- 21 Upper Ladd Hill Rd Unit B
- 21 Barnard Ridge Rd
- 20 True Rd Unit 85
- 20 True Rd Unit 52
- 20 True Rd Unit 101
- 20 True Rd Unit 22
- 20 True Rd Unit 73
- 20 True Rd Unit 94
- 20 True Rd Unit 93
- 34-35-36 Commerce Ct
- 455 Daniel Webster Hwy
- 53 Oak Knoll Rd
- 47 Clover Ridge Rd
- 57 Winona Rd
- 28 Red Gate Ln
- 34 Red Gate Ln
- 33 Red Gate Ln
- 24 Red Gate Ln
- 408-1A-3 Red Gate Ln
- 25 Red Gate Ln
- 0 Highland St
- 23 Red Gate Ln
- 22 Red Gate Ln
- 26 Highland St
- 36 Highland St
- 19 Red Gate Ln
- 28 Highland St
- 24 Highland St
- 32 Highland St
- 30 Highland St
- 16 Red Gate Ln
- 37 Highland St
- 15 Red Gate Ln
- 33 Highland St
Your Personal Tour Guide
Ask me questions while you tour the home.