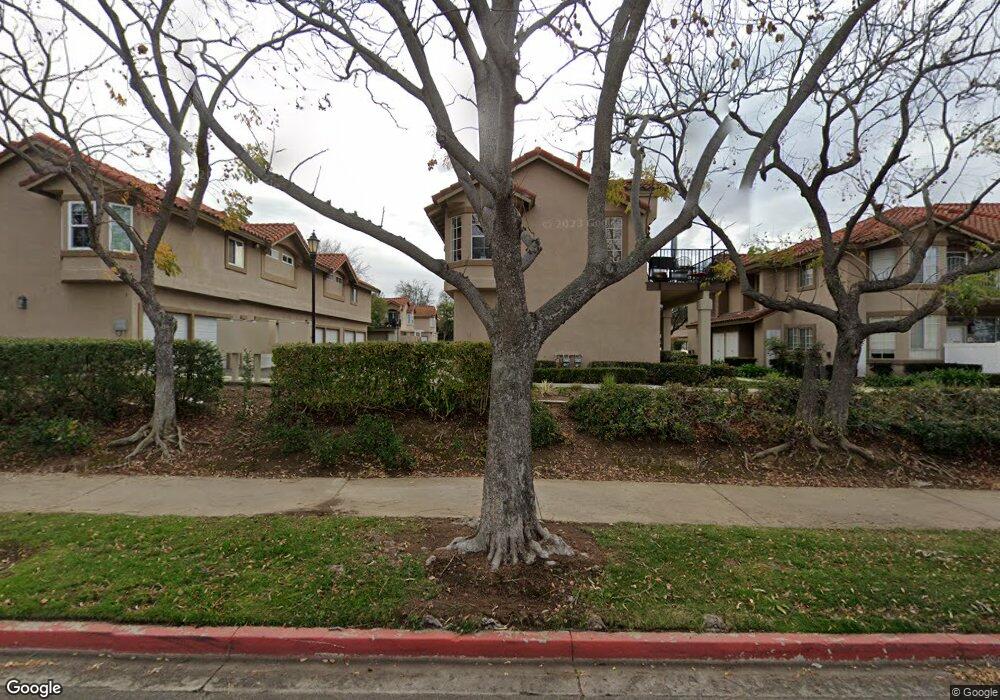
30 Redbud Unit 135 Rancho Santa Margarita, CA 92688
Estimated Value: $546,985 - $613,000
2
Beds
2
Baths
960
Sq Ft
$612/Sq Ft
Est. Value
About This Home
This home is located at 30 Redbud Unit 135, Rancho Santa Margarita, CA 92688 and is currently estimated at $587,246, approximately $611 per square foot. 30 Redbud Unit 135 is a home located in Orange County with nearby schools including Trabuco Mesa Elementary School, Rancho Santa Margarita Intermediate School, and Trabuco Hills High School.
Ownership History
Date
Name
Owned For
Owner Type
Purchase Details
Closed on
Aug 11, 2016
Sold by
Thompson Michele
Bought by
Thompson Michele T and Michele T Thompson Trust
Current Estimated Value
Purchase Details
Closed on
Apr 17, 2000
Sold by
Sherman Jeffrey John and Sherman Linda
Bought by
Thompson Michele
Home Financials for this Owner
Home Financials are based on the most recent Mortgage that was taken out on this home.
Original Mortgage
$118,200
Outstanding Balance
$38,716
Interest Rate
7.62%
Estimated Equity
$548,530
Purchase Details
Closed on
Jun 9, 1993
Sold by
Sherman Jeffrey John
Bought by
Sherman Jeffrey John and Sherman Linda
Home Financials for this Owner
Home Financials are based on the most recent Mortgage that was taken out on this home.
Original Mortgage
$89,093
Interest Rate
7.38%
Mortgage Type
Assumption
Create a Home Valuation Report for This Property
The Home Valuation Report is an in-depth analysis detailing your home's value as well as a comparison with similar homes in the area
Home Values in the Area
Average Home Value in this Area
Purchase History
| Date | Buyer | Sale Price | Title Company |
|---|---|---|---|
| Thompson Michele T | -- | None Available | |
| Thompson Michele | $148,000 | Orange Coast Title | |
| Sherman Jeffrey John | -- | Chicago Title Company |
Source: Public Records
Mortgage History
| Date | Status | Borrower | Loan Amount |
|---|---|---|---|
| Open | Thompson Michele | $118,200 | |
| Previous Owner | Sherman Jeffrey John | $89,093 |
Source: Public Records
Tax History Compared to Growth
Tax History
| Year | Tax Paid | Tax Assessment Tax Assessment Total Assessment is a certain percentage of the fair market value that is determined by local assessors to be the total taxable value of land and additions on the property. | Land | Improvement |
|---|---|---|---|---|
| 2025 | $2,260 | $227,458 | $114,581 | $112,877 |
| 2024 | $2,260 | $222,999 | $112,335 | $110,664 |
| 2023 | $2,207 | $218,627 | $110,132 | $108,495 |
| 2022 | $2,168 | $214,341 | $107,973 | $106,368 |
| 2021 | $1,678 | $210,139 | $105,856 | $104,283 |
| 2020 | $2,108 | $207,985 | $104,771 | $103,214 |
| 2019 | $2,276 | $203,907 | $102,716 | $101,191 |
| 2018 | $2,240 | $199,909 | $100,702 | $99,207 |
| 2017 | $2,250 | $195,990 | $98,728 | $97,262 |
| 2016 | $2,526 | $192,148 | $96,793 | $95,355 |
| 2015 | $2,619 | $189,262 | $95,339 | $93,923 |
| 2014 | $2,574 | $185,555 | $93,471 | $92,084 |
Source: Public Records
Map
Nearby Homes
- 21 Silktassel
- 25 Dewberry
- 225 Montana Del Lago Dr
- 28 Montana Del Lago Dr Unit 159
- 231 Montana Del Lago Dr Unit 22
- 250 Montana Del Lago Dr
- 16 Las Piedras
- 73 Gaviota
- 31 Gaviota Unit 136
- 31 Brisa Del Lago
- 54 Gavilan
- 70 Gavilan Unit 18
- 1 Brisa Del Lago
- 34 Dianthus
- 4 Pica Flor Unit 54
- 1 El Canto
- 21 Lobelia
- 19 Vista Barranca Unit 75
- 12 El Vaquero
- 23 Vista Colinas
- 1 Redbud Unit 125
- 25 Redbud Unit 123
- 25 Redbud Unit 64
- 27 Redbud Unit 124
- 27 Redbud
- 21 Redbud Unit 121
- 23 Redbud Unit 122
- 11 Silktassel Unit 148
- 15 Redbud Unit 69
- 31 Redbud Unit 132
- 31 Redbud
- 19 Redbud Unit 120
- 17 Redbud Unit 119
- 7 Redbud Unit 128
- 9 Redbud Unit 129
- 11 Redbud Unit 71
- 3 Redbud Unit 126
- 5 Redbud Unit 127
- 31 Silktassel Unit 151
- 29 Silktassel Unit 150