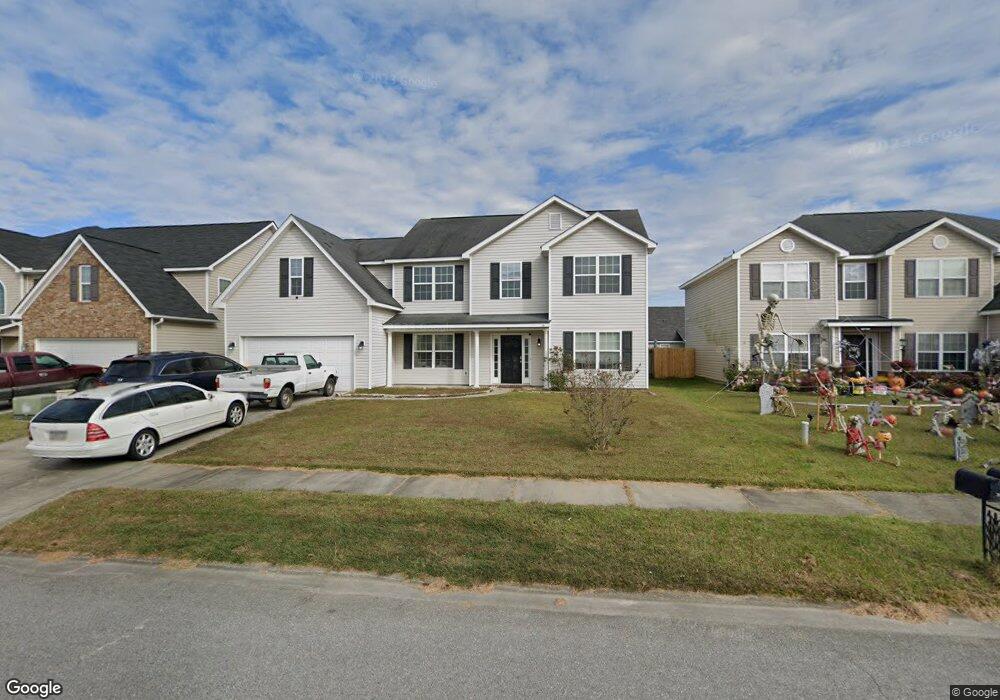
30 Rice Creek Rd Savannah, GA 31407
Estimated Value: $381,000 - $417,000
5
Beds
4
Baths
3,460
Sq Ft
$116/Sq Ft
Est. Value
About This Home
This home is located at 30 Rice Creek Rd, Savannah, GA 31407 and is currently estimated at $399,809, approximately $115 per square foot. 30 Rice Creek Rd is a home located in Chatham County with nearby schools including Rice Creek K-8 School and Groves High School.
Ownership History
Date
Name
Owned For
Owner Type
Purchase Details
Closed on
Aug 31, 2020
Sold by
Wooten Martia G
Bought by
Hodges Charles B
Current Estimated Value
Home Financials for this Owner
Home Financials are based on the most recent Mortgage that was taken out on this home.
Original Mortgage
$250,635
Outstanding Balance
$222,422
Interest Rate
2.9%
Mortgage Type
VA
Estimated Equity
$177,387
Purchase Details
Closed on
May 28, 2010
Sold by
Wooten Martia G
Bought by
Wooten Martia G and Wooten Ricardo R
Home Financials for this Owner
Home Financials are based on the most recent Mortgage that was taken out on this home.
Original Mortgage
$235,884
Interest Rate
5%
Mortgage Type
VA
Purchase Details
Closed on
Mar 7, 2008
Sold by
Not Provided
Bought by
Wooten Martia G and Wooten Ricardo R
Create a Home Valuation Report for This Property
The Home Valuation Report is an in-depth analysis detailing your home's value as well as a comparison with similar homes in the area
Home Values in the Area
Average Home Value in this Area
Purchase History
| Date | Buyer | Sale Price | Title Company |
|---|---|---|---|
| Hodges Charles B | $245,000 | -- | |
| Wooten Martia G | -- | -- | |
| Wooten Martia G | $230,920 | -- | |
| Lamar Smith Signature | -- | -- | |
| Wooten Martia G | $252,900 | -- |
Source: Public Records
Mortgage History
| Date | Status | Borrower | Loan Amount |
|---|---|---|---|
| Open | Hodges Charles B | $250,635 | |
| Previous Owner | Lamar Smith Signature | $235,884 |
Source: Public Records
Tax History Compared to Growth
Tax History
| Year | Tax Paid | Tax Assessment Tax Assessment Total Assessment is a certain percentage of the fair market value that is determined by local assessors to be the total taxable value of land and additions on the property. | Land | Improvement |
|---|---|---|---|---|
| 2025 | $5,967 | $168,400 | $30,000 | $138,400 |
| 2024 | $5,967 | $164,760 | $26,000 | $138,760 |
| 2023 | $4,978 | $154,080 | $20,000 | $134,080 |
| 2022 | $3,316 | $119,960 | $14,000 | $105,960 |
| 2021 | $3,218 | $98,000 | $13,160 | $84,840 |
| 2020 | $3,416 | $101,520 | $14,000 | $87,520 |
| 2019 | $3,416 | $98,760 | $12,000 | $86,760 |
| 2018 | $2,851 | $95,360 | $12,000 | $83,360 |
| 2017 | $2,833 | $87,600 | $12,600 | $75,000 |
| 2016 | $2,833 | $86,520 | $12,600 | $73,920 |
| 2015 | $2,866 | $87,400 | $12,600 | $74,800 |
| 2014 | $4,254 | $88,480 | $0 | $0 |
Source: Public Records
Map
Nearby Homes
- 17 Sea Oats Dr
- 109 Miller Park Cir
- 87 Marsh Salt Ln
- Dayton Plan at Brookline
- Spring Valley II Plan at Brookline
- Stillwater Plan at Brookline
- Grayson TR Plan at Rice Creek
- Richmond Plan at Brookline
- Spring Garden TR Plan at Rice Creek
- Crestview Plan at Brookline
- Spring Valley II TR Plan at Rice Creek
- Bismarck II TR Plan at Rice Creek
- Blue Ridge TR Plan at Rice Creek
- Crestview TR Plan at Rice Creek
- Pinehurst II Plan at Brookline
- Avery Plan at Brookline
- Brookline Plan at Brookline
- 106 Marsh Salt Ln
- 84 Marsh Salt Ln
- 93 Marsh Salt Ln
- 30 Rice Creek Rd
- 32 Rice Creek Rd
- 32 Rice Creek Rd
- 28 Rice Creek Rd
- 28 Rice Creek Rd
- 7 Heritage Rd
- 9 Heritage Rd
- 5 Heritage Rd
- 5 Heritage Woods
- 5 Heritage Woods Unit 5
- 34 Rice Creek Rd
- 26 Rice Creek Rd
- 26 Rice Creek Rd
- 11 Heritage Rd
- 3 Heritage Rd
- 1 Fitzwater Rd
- 1 Fitzwater Rd
- 24 Rice Creek Rd
- 2 Fitzwater Rd
- 2 Fitzwater Rd