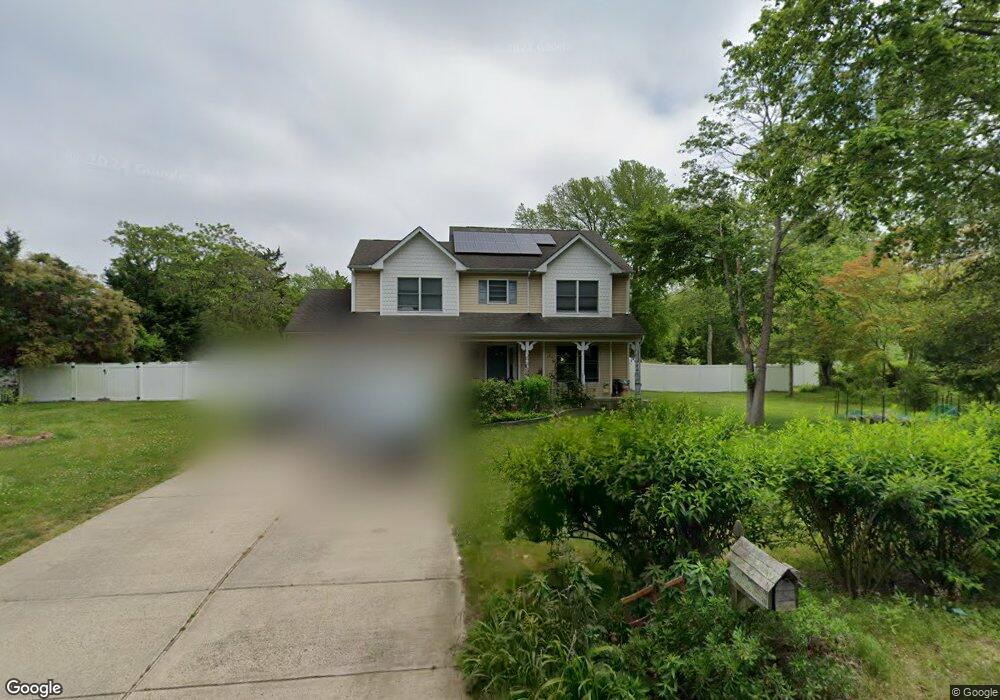
30 Ridgeway St Barnegat, NJ 08005
Barnegat Township NeighborhoodEstimated Value: $611,000 - $703,000
4
Beds
3
Baths
2,238
Sq Ft
$290/Sq Ft
Est. Value
About This Home
This home is located at 30 Ridgeway St, Barnegat, NJ 08005 and is currently estimated at $649,709, approximately $290 per square foot. 30 Ridgeway St is a home located in Ocean County with nearby schools including Barnegat High School.
Ownership History
Date
Name
Owned For
Owner Type
Purchase Details
Closed on
May 7, 2003
Sold by
Gerundo Robert
Bought by
Paul Richard and Paul Susan
Current Estimated Value
Home Financials for this Owner
Home Financials are based on the most recent Mortgage that was taken out on this home.
Original Mortgage
$159,900
Outstanding Balance
$69,749
Interest Rate
5.84%
Estimated Equity
$579,960
Purchase Details
Closed on
Mar 13, 1998
Sold by
Bair Alfred C
Bought by
Stevenson Kyle A
Create a Home Valuation Report for This Property
The Home Valuation Report is an in-depth analysis detailing your home's value as well as a comparison with similar homes in the area
Home Values in the Area
Average Home Value in this Area
Purchase History
| Date | Buyer | Sale Price | Title Company |
|---|---|---|---|
| Paul Richard | $259,900 | -- | |
| Stevenson Kyle A | $2,000 | -- |
Source: Public Records
Mortgage History
| Date | Status | Borrower | Loan Amount |
|---|---|---|---|
| Open | Paul Richard | $159,900 |
Source: Public Records
Tax History Compared to Growth
Tax History
| Year | Tax Paid | Tax Assessment Tax Assessment Total Assessment is a certain percentage of the fair market value that is determined by local assessors to be the total taxable value of land and additions on the property. | Land | Improvement |
|---|---|---|---|---|
| 2025 | $9,631 | $323,500 | $117,500 | $206,000 |
| 2024 | $9,417 | $323,500 | $117,500 | $206,000 |
| 2023 | $9,113 | $323,500 | $117,500 | $206,000 |
| 2022 | $9,113 | $323,500 | $117,500 | $206,000 |
| 2021 | $9,071 | $323,500 | $117,500 | $206,000 |
| 2020 | $9,029 | $323,500 | $117,500 | $206,000 |
| 2019 | $8,896 | $323,500 | $117,500 | $206,000 |
| 2018 | $8,828 | $323,500 | $117,500 | $206,000 |
| 2017 | $8,683 | $323,500 | $117,500 | $206,000 |
| 2016 | $8,505 | $323,500 | $117,500 | $206,000 |
| 2015 | $8,236 | $323,500 | $117,500 | $206,000 |
| 2014 | $8,026 | $323,500 | $117,500 | $206,000 |
Source: Public Records
Map
Nearby Homes