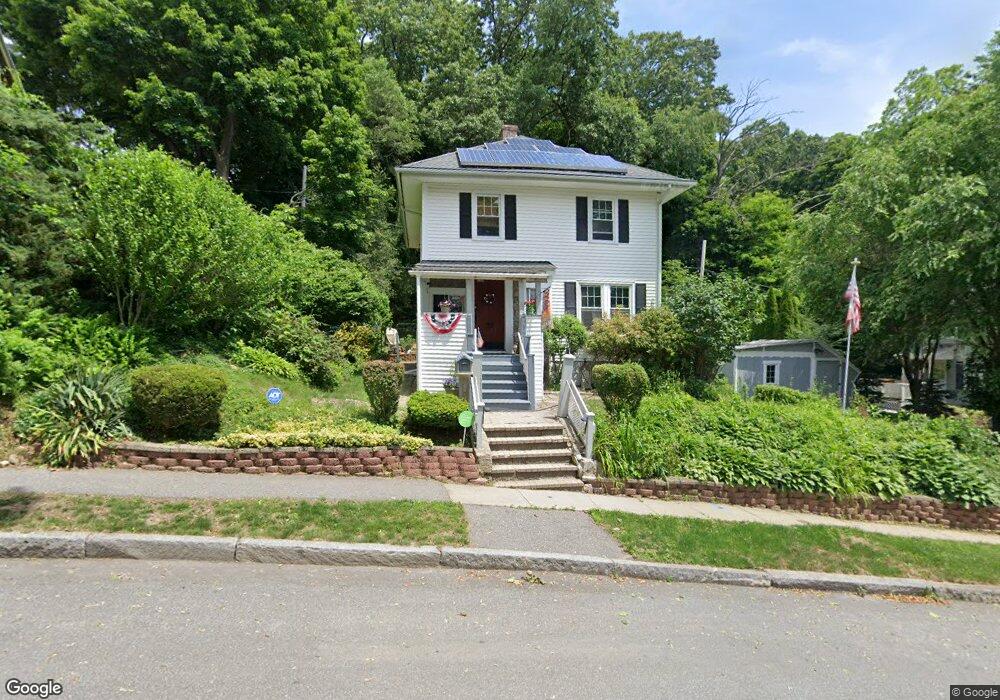
30 Rob Roy Rd Worcester, MA 01602
Newton Square NeighborhoodEstimated Value: $383,000 - $458,000
3
Beds
2
Baths
1,372
Sq Ft
$305/Sq Ft
Est. Value
About This Home
This home is located at 30 Rob Roy Rd, Worcester, MA 01602 and is currently estimated at $419,076, approximately $305 per square foot. 30 Rob Roy Rd is a home located in Worcester County with nearby schools including Chandler Magnet, Jacob Hiatt Magnet School, and May Street Elementary School.
Ownership History
Date
Name
Owned For
Owner Type
Purchase Details
Closed on
Apr 25, 2005
Sold by
Trzcinski Dolores M and Trzcinski Ida M
Bought by
Trzcinski Dolores and Auger-Trzcinski Marie
Current Estimated Value
Home Financials for this Owner
Home Financials are based on the most recent Mortgage that was taken out on this home.
Original Mortgage
$291,650
Outstanding Balance
$150,398
Interest Rate
5.87%
Mortgage Type
Purchase Money Mortgage
Estimated Equity
$268,678
Purchase Details
Closed on
Mar 28, 1995
Sold by
Cohen Melvin and Cohen Thelma
Bought by
Auger Marie and Trzcinski Dolores
Create a Home Valuation Report for This Property
The Home Valuation Report is an in-depth analysis detailing your home's value as well as a comparison with similar homes in the area
Home Values in the Area
Average Home Value in this Area
Purchase History
| Date | Buyer | Sale Price | Title Company |
|---|---|---|---|
| Trzcinski Dolores | -- | -- | |
| Auger Marie | $102,000 | -- |
Source: Public Records
Mortgage History
| Date | Status | Borrower | Loan Amount |
|---|---|---|---|
| Open | Trzcinski Dolores | $291,650 | |
| Previous Owner | Auger Marie | $181,298 | |
| Previous Owner | Auger Marie | $75,000 | |
| Previous Owner | Auger Marie | $50,000 |
Source: Public Records
Tax History
| Year | Tax Paid | Tax Assessment Tax Assessment Total Assessment is a certain percentage of the fair market value that is determined by local assessors to be the total taxable value of land and additions on the property. | Land | Improvement |
|---|---|---|---|---|
| 2025 | $4,664 | $353,600 | $117,600 | $236,000 |
| 2024 | $4,494 | $326,800 | $117,600 | $209,200 |
| 2023 | $4,309 | $300,500 | $102,200 | $198,300 |
| 2022 | $3,965 | $260,700 | $81,800 | $178,900 |
| 2021 | $3,855 | $236,800 | $65,400 | $171,400 |
| 2020 | $3,694 | $217,300 | $65,400 | $151,900 |
| 2019 | $3,557 | $197,600 | $58,800 | $138,800 |
| 2018 | $3,559 | $188,200 | $58,800 | $129,400 |
| 2017 | $3,423 | $178,100 | $58,800 | $119,300 |
| 2016 | $3,359 | $163,000 | $42,700 | $120,300 |
| 2015 | $3,271 | $163,000 | $42,700 | $120,300 |
| 2014 | $3,142 | $160,800 | $42,700 | $118,100 |
Source: Public Records
Map
Nearby Homes
- 24 Hadwen Rd
- 16 Sherwood Rd
- 18 Hadwen Ln
- 33 Carlisle St
- 108 Longfellow Rd
- 3 Franconia St
- 19 Kenilworth Rd
- 32 Zenith Dr
- 3A Chalmers Rd
- 15 Longfellow Rd
- 6 Newton Ave
- 19 Highland Terrace
- 3 Suburban Rd
- 322 Highland St
- 31 Lenox St
- 7 Longworth Rd
- 6 Ludington Rd
- 34 Rosslare Dr Unit 108
- 83 Newton Ave N
- 93 Newton Ave N
Your Personal Tour Guide
Ask me questions while you tour the home.