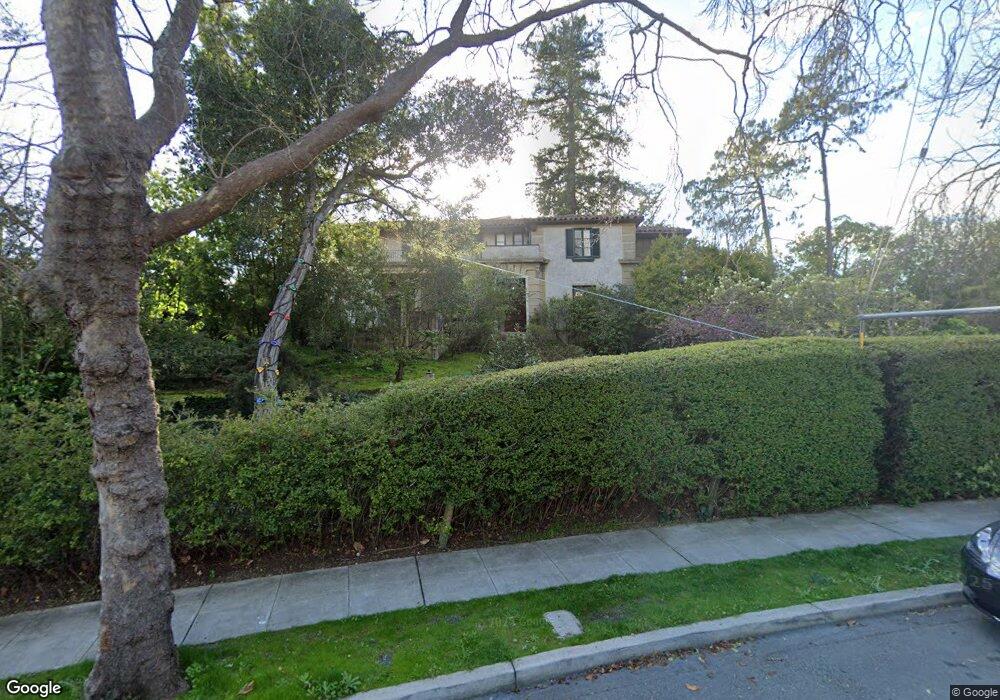
30 Roble Rd Berkeley, CA 94705
Claremont NeighborhoodEstimated Value: $3,038,000 - $3,715,000
5
Beds
5
Baths
4,506
Sq Ft
$760/Sq Ft
Est. Value
About This Home
This home is located at 30 Roble Rd, Berkeley, CA 94705 and is currently estimated at $3,426,248, approximately $760 per square foot. 30 Roble Rd is a home located in Alameda County with nearby schools including John Muir Elementary School, Emerson Elementary School, and Malcolm X Elementary School.
Ownership History
Date
Name
Owned For
Owner Type
Purchase Details
Closed on
Nov 24, 2018
Sold by
Dapice Joshua J and Dapice Nancy M
Bought by
Dapice Joshua J and Flynn Nancy M
Current Estimated Value
Home Financials for this Owner
Home Financials are based on the most recent Mortgage that was taken out on this home.
Original Mortgage
$500,000
Outstanding Balance
$415,771
Interest Rate
4.8%
Mortgage Type
Credit Line Revolving
Estimated Equity
$3,010,477
Purchase Details
Closed on
Dec 30, 2015
Sold by
Dapice Joshua J and Flynn Nancy M
Bought by
The Sege Trust
Purchase Details
Closed on
Apr 25, 2011
Sold by
Garrett Joseph L and Garrett Neysa
Bought by
Dapice Joshua J and Flynn Nancy M
Home Financials for this Owner
Home Financials are based on the most recent Mortgage that was taken out on this home.
Original Mortgage
$270,250
Interest Rate
4.84%
Mortgage Type
Credit Line Revolving
Create a Home Valuation Report for This Property
The Home Valuation Report is an in-depth analysis detailing your home's value as well as a comparison with similar homes in the area
Home Values in the Area
Average Home Value in this Area
Purchase History
| Date | Buyer | Sale Price | Title Company |
|---|---|---|---|
| Dapice Joshua J | -- | North American Title Company | |
| The Sege Trust | -- | None Available | |
| Dapice Joshua J | -- | Old Republic Title Company |
Source: Public Records
Mortgage History
| Date | Status | Borrower | Loan Amount |
|---|---|---|---|
| Open | Dapice Joshua J | $500,000 | |
| Closed | Dapice Joshua J | $270,250 |
Source: Public Records
Tax History
| Year | Tax Paid | Tax Assessment Tax Assessment Total Assessment is a certain percentage of the fair market value that is determined by local assessors to be the total taxable value of land and additions on the property. | Land | Improvement |
|---|---|---|---|---|
| 2025 | $41,278 | $2,779,391 | $835,917 | $1,950,474 |
| 2024 | $41,278 | $2,724,777 | $819,533 | $1,912,244 |
| 2023 | $40,427 | $2,678,228 | $803,468 | $1,874,760 |
| 2022 | $39,723 | $2,618,724 | $787,717 | $1,838,007 |
| 2021 | $39,843 | $2,567,242 | $772,272 | $1,801,970 |
| 2020 | $37,730 | $2,547,860 | $764,358 | $1,783,502 |
| 2019 | $36,287 | $2,497,921 | $749,376 | $1,748,545 |
| 2018 | $35,692 | $2,448,962 | $734,688 | $1,714,274 |
| 2017 | $34,527 | $2,400,960 | $720,288 | $1,680,672 |
| 2016 | $33,473 | $2,353,893 | $706,168 | $1,647,725 |
| 2015 | $33,028 | $2,318,550 | $695,565 | $1,622,985 |
| 2014 | $32,584 | $2,273,135 | $681,940 | $1,591,195 |
Source: Public Records
Map
Nearby Homes
- 0 Tunnel Rd
- 45 Vicente Rd
- 204 El Camino Real
- 1488 Alvarado Rd
- 5668 Buena Vista Ave
- 150 Vicente Rd
- 260 Alvarado Rd
- 641 Alvarado Rd
- 1426 Grand View Dr
- 142 Gravatt Dr
- 29 Live Oak Rd
- 0 Gravatt Dr Unit 41122154
- 11 Hawks Hill Ct
- 5416 Golden Gate Ave
- 2 Gravatt Dr
- 6189 Margarido Dr
- 1102 Grand View Dr
- 287 Cross Rd
- 1881 Grand View Dr
- 244 Cross Rd
Your Personal Tour Guide
Ask me questions while you tour the home.