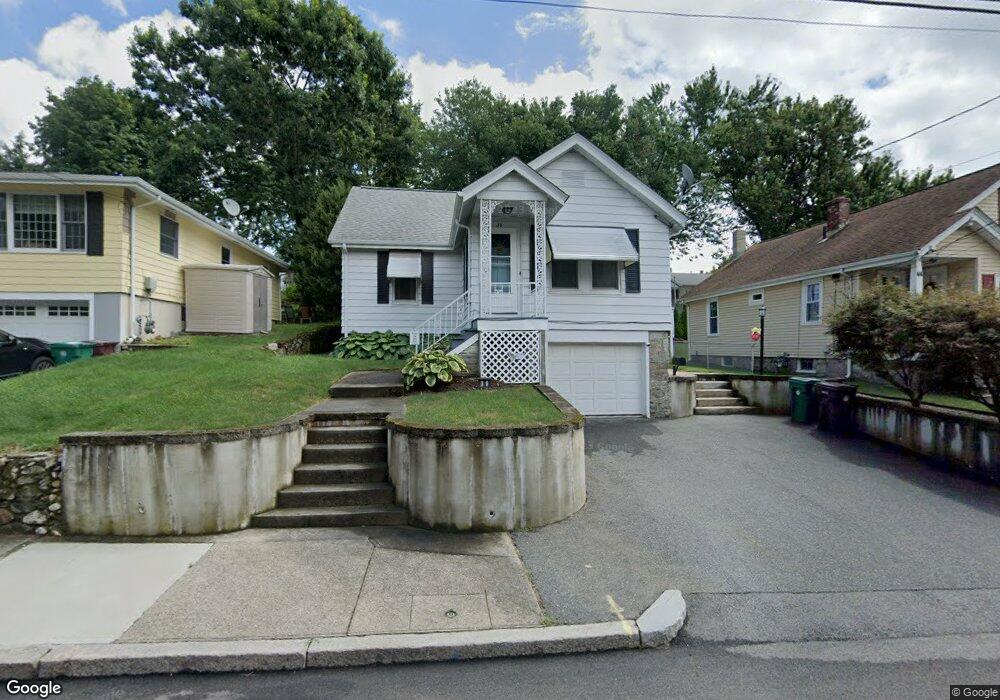
30 Rodman St Woonsocket, RI 02895
East Woonsocket NeighborhoodEstimated Value: $337,306 - $367,000
2
Beds
2
Baths
1,196
Sq Ft
$299/Sq Ft
Est. Value
About This Home
This home is located at 30 Rodman St, Woonsocket, RI 02895 and is currently estimated at $357,827, approximately $299 per square foot. 30 Rodman St is a home located in Providence County with nearby schools including Woonsocket High School and Good Shepherd Catholic School.
Ownership History
Date
Name
Owned For
Owner Type
Purchase Details
Closed on
Apr 27, 2018
Sold by
Giguere Diane M
Bought by
Diane M Giguere Lt and Giguere
Current Estimated Value
Purchase Details
Closed on
Feb 16, 2001
Sold by
Godin Lucille J and Godin Richard R
Bought by
Goralski Diane M and Goralski Giguere C
Create a Home Valuation Report for This Property
The Home Valuation Report is an in-depth analysis detailing your home's value as well as a comparison with similar homes in the area
Home Values in the Area
Average Home Value in this Area
Purchase History
| Date | Buyer | Sale Price | Title Company |
|---|---|---|---|
| Diane M Giguere Lt | -- | -- | |
| Goralski Diane M | $115,000 | -- | |
| Diane M Giguere Lt | -- | -- | |
| Goralski Diane M | $115,000 | -- |
Source: Public Records
Mortgage History
| Date | Status | Borrower | Loan Amount |
|---|---|---|---|
| Previous Owner | Goralski Diane M | $123,526 | |
| Previous Owner | Goralski Diane M | $140,000 | |
| Previous Owner | Goralski Diane M | $12,000 |
Source: Public Records
Tax History Compared to Growth
Tax History
| Year | Tax Paid | Tax Assessment Tax Assessment Total Assessment is a certain percentage of the fair market value that is determined by local assessors to be the total taxable value of land and additions on the property. | Land | Improvement |
|---|---|---|---|---|
| 2025 | $3,577 | $318,500 | $103,900 | $214,600 |
| 2024 | $3,506 | $241,100 | $92,200 | $148,900 |
| 2023 | $3,371 | $241,100 | $92,200 | $148,900 |
| 2022 | $3,371 | $241,100 | $92,200 | $148,900 |
| 2021 | $2,773 | $155,700 | $55,900 | $99,800 |
| 2020 | $3,737 | $155,700 | $55,900 | $99,800 |
| 2018 | $3,749 | $155,700 | $55,900 | $99,800 |
| 2017 | $3,991 | $132,600 | $45,300 | $87,300 |
| 2016 | $4,222 | $132,600 | $45,300 | $87,300 |
| 2015 | $4,851 | $132,600 | $45,300 | $87,300 |
| 2014 | $3,308 | $131,500 | $49,900 | $81,600 |
Source: Public Records
Map
Nearby Homes