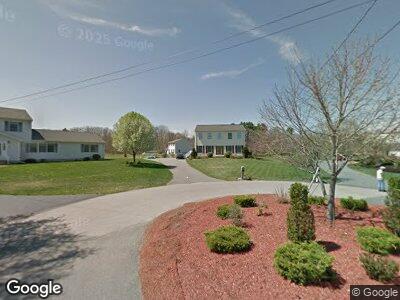
30 Rose Way Taunton, MA 02780
Wades Corner NeighborhoodEstimated Value: $551,000 - $641,000
3
Beds
2
Baths
1,872
Sq Ft
$319/Sq Ft
Est. Value
About This Home
This home is located at 30 Rose Way, Taunton, MA 02780 and is currently estimated at $596,353, approximately $318 per square foot. 30 Rose Way is a home located in Bristol County with nearby schools including Edmund Hatch Bennett School, Benjamin Friedman Middle School, and Taunton High School.
Ownership History
Date
Name
Owned For
Owner Type
Purchase Details
Closed on
Jul 21, 1999
Sold by
Mann David B
Bought by
Spencer Robert P and Spencer Kimberly R
Current Estimated Value
Create a Home Valuation Report for This Property
The Home Valuation Report is an in-depth analysis detailing your home's value as well as a comparison with similar homes in the area
Home Values in the Area
Average Home Value in this Area
Purchase History
| Date | Buyer | Sale Price | Title Company |
|---|---|---|---|
| Spencer Robert P | $65,000 | -- |
Source: Public Records
Mortgage History
| Date | Status | Borrower | Loan Amount |
|---|---|---|---|
| Open | Spencer Robert P | $385,235 | |
| Closed | Spencer Robert P | $385,000 | |
| Closed | Spencer Robert P | $359,000 | |
| Closed | Spencer Kimberly R | $328,000 | |
| Closed | Spencer Kimberly R | $82,000 | |
| Closed | Spencer Robert P | $49,000 | |
| Closed | Spencer Robert P | $301,000 | |
| Closed | Spencer Robert P | $96,850 | |
| Closed | Spencer Robert P | $195,220 | |
| Closed | Spencer Robert P | $65,000 |
Source: Public Records
Tax History Compared to Growth
Tax History
| Year | Tax Paid | Tax Assessment Tax Assessment Total Assessment is a certain percentage of the fair market value that is determined by local assessors to be the total taxable value of land and additions on the property. | Land | Improvement |
|---|---|---|---|---|
| 2025 | $5,395 | $493,100 | $142,400 | $350,700 |
| 2024 | $5,001 | $446,900 | $142,400 | $304,500 |
| 2023 | $4,986 | $413,800 | $136,000 | $277,800 |
| 2022 | $4,875 | $369,900 | $124,100 | $245,800 |
| 2021 | $6 | $335,100 | $112,800 | $222,300 |
| 2020 | $7 | $309,600 | $112,800 | $196,800 |
| 2019 | $7 | $305,600 | $115,200 | $190,400 |
| 2018 | $4,647 | $295,600 | $116,300 | $179,300 |
| 2017 | $6 | $283,000 | $110,300 | $172,700 |
| 2016 | $4,273 | $272,500 | $107,100 | $165,400 |
| 2015 | $4,105 | $273,500 | $110,200 | $163,300 |
| 2014 | $4,081 | $279,300 | $110,200 | $169,100 |
Source: Public Records
Map
Nearby Homes