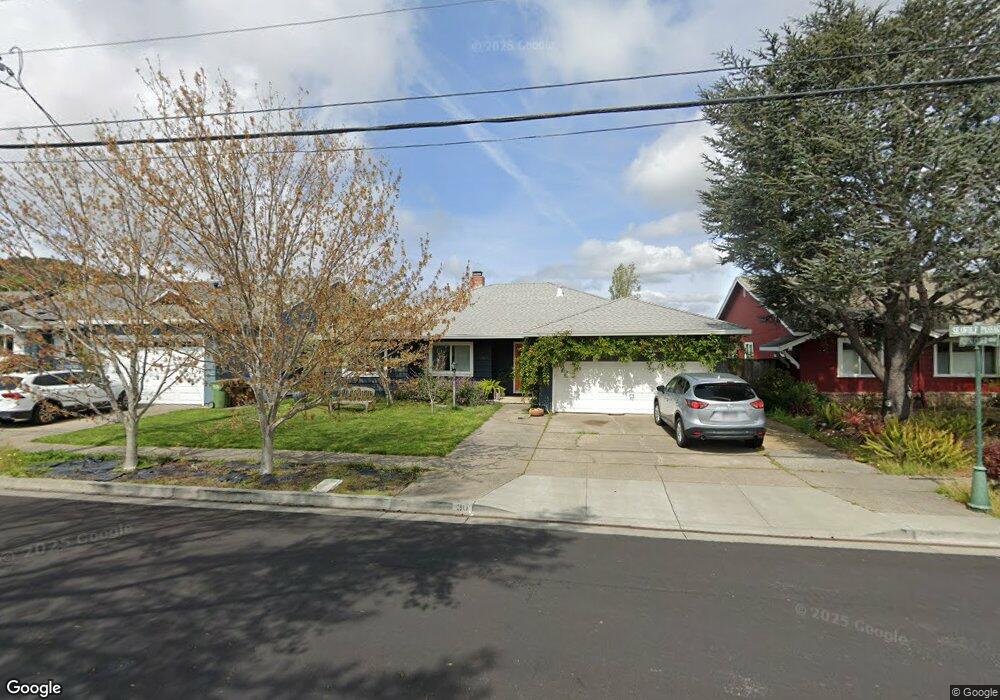
30 Seawolf Passage Corte Madera, CA 94925
Estimated Value: $1,739,000 - $1,849,000
3
Beds
2
Baths
1,622
Sq Ft
$1,108/Sq Ft
Est. Value
About This Home
This home is located at 30 Seawolf Passage, Corte Madera, CA 94925 and is currently estimated at $1,796,428, approximately $1,107 per square foot. 30 Seawolf Passage is a home located in Marin County with nearby schools including The Cove School, Hall Middle School, and Redwood High School.
Ownership History
Date
Name
Owned For
Owner Type
Purchase Details
Closed on
Jul 2, 2020
Sold by
Colety Brian E and De La Fuente
Bought by
Dela Fuente Lisa R
Current Estimated Value
Home Financials for this Owner
Home Financials are based on the most recent Mortgage that was taken out on this home.
Original Mortgage
$863,500
Outstanding Balance
$758,831
Interest Rate
3.1%
Mortgage Type
New Conventional
Estimated Equity
$1,037,597
Purchase Details
Closed on
Feb 2, 2006
Sold by
Maccari Christopher D
Bought by
Colety Brian E and Delafuente Lisa R
Home Financials for this Owner
Home Financials are based on the most recent Mortgage that was taken out on this home.
Original Mortgage
$94,300
Interest Rate
6.2%
Mortgage Type
Credit Line Revolving
Purchase Details
Closed on
Nov 4, 2003
Sold by
Maccari Giuseppe Alberto
Bought by
Maccari Giuseppe Alberto
Purchase Details
Closed on
Nov 12, 1998
Sold by
Maccari Giuseppe A and Maccari Patrina V
Bought by
Maccari Giuseppe Alberto
Create a Home Valuation Report for This Property
The Home Valuation Report is an in-depth analysis detailing your home's value as well as a comparison with similar homes in the area
Home Values in the Area
Average Home Value in this Area
Purchase History
| Date | Buyer | Sale Price | Title Company |
|---|---|---|---|
| Dela Fuente Lisa R | -- | Title 368 | |
| Colety Brian E | $943,000 | California Land Title Marin | |
| Maccari Giuseppe Alberto | -- | -- | |
| Maccari Giuseppe Alberto | -- | -- |
Source: Public Records
Mortgage History
| Date | Status | Borrower | Loan Amount |
|---|---|---|---|
| Open | Dela Fuente Lisa R | $863,500 | |
| Closed | Colety Brian E | $94,300 | |
| Closed | Colety Brian E | $754,400 |
Source: Public Records
Tax History
| Year | Tax Paid | Tax Assessment Tax Assessment Total Assessment is a certain percentage of the fair market value that is determined by local assessors to be the total taxable value of land and additions on the property. | Land | Improvement |
|---|---|---|---|---|
| 2025 | $17,721 | $1,306,958 | $1,024,845 | $282,113 |
| 2024 | $16,939 | $1,281,334 | $1,004,752 | $276,582 |
| 2023 | $16,375 | $1,256,218 | $985,057 | $271,161 |
| 2022 | $16,228 | $1,231,589 | $965,745 | $265,844 |
| 2021 | $15,953 | $1,207,449 | $946,815 | $260,634 |
| 2020 | $15,927 | $1,195,072 | $937,110 | $257,962 |
| 2019 | $15,322 | $1,171,648 | $918,742 | $252,906 |
| 2018 | $15,010 | $1,148,684 | $900,735 | $247,949 |
| 2017 | $14,853 | $1,126,168 | $883,080 | $243,088 |
| 2016 | $12,850 | $980,431 | $779,983 | $200,448 |
| 2015 | $12,034 | $907,807 | $722,207 | $185,600 |
| 2014 | $10,240 | $776,354 | $628,006 | $148,348 |
Source: Public Records
Map
Nearby Homes
- 37 Spindrift Passage
- 14 Mariner Green Dr
- 125 Mariner Green Ct
- 319 Golden Hind Passage
- 834 Meadowsweet Dr
- 37 Creekside Ct
- 1425 Casa Buena Dr Unit 108
- 1411 Casa Buena Dr Unit 31
- 1411 Casa Buena Dr Unit 13
- 1411 Casa Buena Dr Unit 45
- 801 Meadowsweet Dr
- 0 Meadowsweet Dr
- 1163 Meadowsweet Dr
- 815 Meadowsweet Dr
- 137 Koch Rd
- 614 Tamalpais Dr
- 2 Paseo Mirasol
- 2000 Redwood Hwy
- 5002 Paradise Dr
- 31 Via Los Altos
- 26 Seawolf Passage
- 34 Seawolf Passage
- 38 Seawolf Passage
- 22 Seawolf Passage
- 25 Seawolf Passage
- 42 Seawolf Passage
- 18 Seawolf Passage
- 41 Flying Cloud Course
- 22 Flying Cloud Course
- 9 Key Largo Cove
- 21 Seawolf Passage
- 46 Seawolf Passage
- 37 Flying Cloud Course
- 5 Key Largo Cove
- 37 Seawolf Passage
- 157 Yolo St
- 18 Flying Cloud Course Unkn
- 18 Flying Cloud Course
- 29 Flying Cloud Course
- 146 Yolo St
Your Personal Tour Guide
Ask me questions while you tour the home.