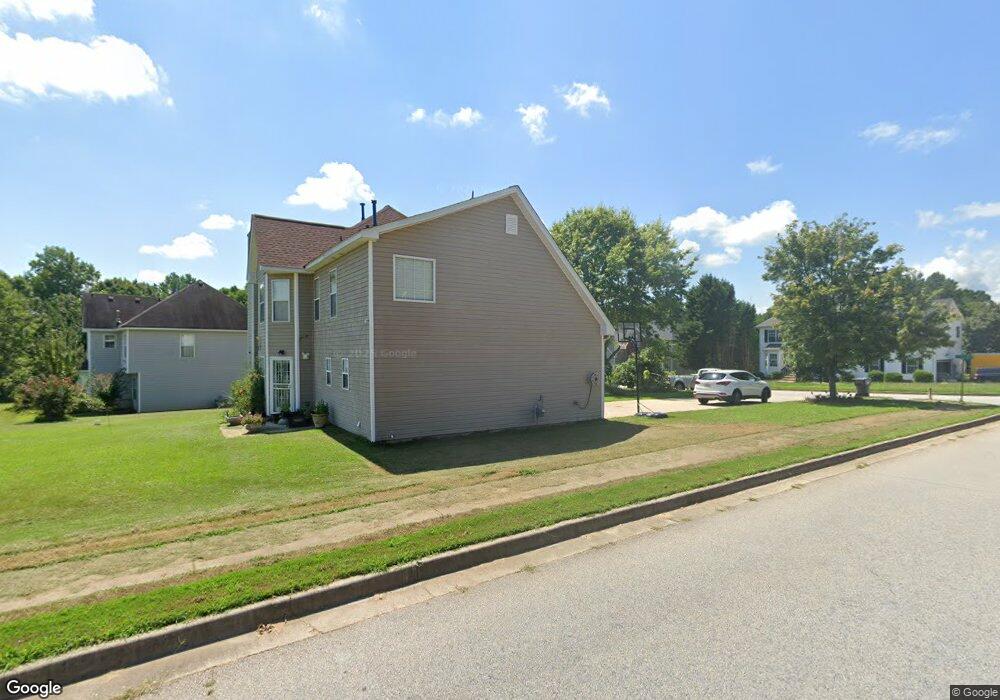
30 Short Cir Covington, GA 30016
Estimated Value: $322,000 - $370,000
--
Bed
2
Baths
2,126
Sq Ft
$160/Sq Ft
Est. Value
About This Home
This home is located at 30 Short Cir, Covington, GA 30016 and is currently estimated at $339,496, approximately $159 per square foot. 30 Short Cir is a home located in Newton County with nearby schools including Live Oak Elementary School, Liberty Middle School, and Newton High School.
Ownership History
Date
Name
Owned For
Owner Type
Purchase Details
Closed on
Mar 18, 2024
Sold by
Ranger Oneil
Bought by
Ranger Oneil and Ranger Vanassa
Current Estimated Value
Purchase Details
Closed on
Aug 12, 2008
Sold by
Hud-Housing Of Urban Dev
Bought by
Ranger Oneil O
Home Financials for this Owner
Home Financials are based on the most recent Mortgage that was taken out on this home.
Original Mortgage
$107,350
Interest Rate
6.31%
Mortgage Type
New Conventional
Purchase Details
Closed on
Sep 4, 2007
Sold by
Suntrust Mtg Inc
Bought by
Secretary Of Hud
Purchase Details
Closed on
Jan 31, 2005
Sold by
Creekwood Hms Inc
Bought by
Scott Amber
Home Financials for this Owner
Home Financials are based on the most recent Mortgage that was taken out on this home.
Original Mortgage
$174,650
Interest Rate
5.68%
Mortgage Type
VA
Create a Home Valuation Report for This Property
The Home Valuation Report is an in-depth analysis detailing your home's value as well as a comparison with similar homes in the area
Home Values in the Area
Average Home Value in this Area
Purchase History
| Date | Buyer | Sale Price | Title Company |
|---|---|---|---|
| Ranger Oneil | -- | -- | |
| Ranger Oneil O | -- | -- | |
| Secretary Of Hud | -- | -- | |
| Suntrust Mtg Inc | $182,496 | -- | |
| Scott Amber | $177,500 | -- |
Source: Public Records
Mortgage History
| Date | Status | Borrower | Loan Amount |
|---|---|---|---|
| Previous Owner | Ranger Oneil O | $107,350 | |
| Previous Owner | Scott Amber | $174,650 |
Source: Public Records
Tax History Compared to Growth
Tax History
| Year | Tax Paid | Tax Assessment Tax Assessment Total Assessment is a certain percentage of the fair market value that is determined by local assessors to be the total taxable value of land and additions on the property. | Land | Improvement |
|---|---|---|---|---|
| 2024 | $3,630 | $145,360 | $17,600 | $127,760 |
| 2023 | $3,861 | $144,480 | $7,200 | $137,280 |
| 2022 | $2,865 | $107,760 | $7,200 | $100,560 |
| 2021 | $2,156 | $73,480 | $7,200 | $66,280 |
| 2020 | $2,158 | $66,800 | $7,200 | $59,600 |
| 2019 | $1,984 | $60,760 | $7,200 | $53,560 |
| 2018 | $1,901 | $57,960 | $7,200 | $50,760 |
| 2017 | $1,447 | $44,760 | $7,200 | $37,560 |
| 2016 | $1,337 | $41,560 | $4,000 | $37,560 |
| 2015 | $1,149 | $36,080 | $4,000 | $32,080 |
| 2014 | $1,147 | $36,080 | $0 | $0 |
Source: Public Records
Map
Nearby Homes