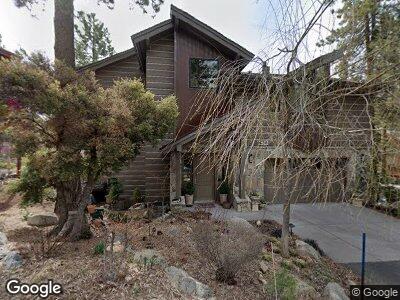
30 Somers Loop Crystal Bay, NV 89402
Estimated Value: $1,679,000 - $3,633,000
4
Beds
4
Baths
3,625
Sq Ft
$845/Sq Ft
Est. Value
About This Home
This home is located at 30 Somers Loop, Crystal Bay, NV 89402 and is currently estimated at $3,062,064, approximately $844 per square foot. 30 Somers Loop is a home located in Washoe County with nearby schools including Incline Elementary School, Incline Middle School, and Incline High School.
Ownership History
Date
Name
Owned For
Owner Type
Purchase Details
Closed on
Sep 26, 2023
Sold by
Buck Teresa
Bought by
Teresa Buck Trust and Buck
Current Estimated Value
Purchase Details
Closed on
Mar 24, 2011
Sold by
Bank Of America N A
Bought by
Buck Richard and Buck Teresa
Purchase Details
Closed on
Jan 14, 2011
Sold by
Gilanfarr Philip and Gilanfarr Lysa
Bought by
Bank Of America N A
Purchase Details
Closed on
Feb 27, 2009
Sold by
Gilanfarr Lysa and Hill Lysa Michelle
Bought by
Gilanfarr Philip
Purchase Details
Closed on
Sep 25, 2006
Sold by
Landau Arnold and Kliman Shirley
Bought by
Gilanfarr Philip and Gilanfarr Lysa
Home Financials for this Owner
Home Financials are based on the most recent Mortgage that was taken out on this home.
Original Mortgage
$400,000
Interest Rate
7.25%
Mortgage Type
Unknown
Create a Home Valuation Report for This Property
The Home Valuation Report is an in-depth analysis detailing your home's value as well as a comparison with similar homes in the area
Home Values in the Area
Average Home Value in this Area
Purchase History
| Date | Buyer | Sale Price | Title Company |
|---|---|---|---|
| Teresa Buck Trust | -- | None Listed On Document | |
| Buck Richard | $1,125,000 | Ticor Title Reno | |
| Bank Of America N A | $1,035,000 | Pasion Title Services | |
| Gilanfarr Philip | -- | None Available | |
| Gilanfarr Philip | $450,000 | First American Title |
Source: Public Records
Mortgage History
| Date | Status | Borrower | Loan Amount |
|---|---|---|---|
| Previous Owner | Gilanfarr Philip | $1,948,000 | |
| Previous Owner | Gilanfarr Philip | $400,000 |
Source: Public Records
Tax History Compared to Growth
Tax History
| Year | Tax Paid | Tax Assessment Tax Assessment Total Assessment is a certain percentage of the fair market value that is determined by local assessors to be the total taxable value of land and additions on the property. | Land | Improvement |
|---|---|---|---|---|
| 2025 | $17,212 | $606,741 | $183,750 | $422,991 |
| 2024 | $17,212 | $592,694 | $166,250 | $426,444 |
| 2023 | $12,466 | $549,592 | $148,750 | $400,842 |
| 2022 | $16,590 | $469,527 | $113,750 | $355,777 |
| 2021 | $15,770 | $451,919 | $103,250 | $348,669 |
| 2020 | $15,542 | $445,351 | $103,250 | $342,101 |
| 2019 | $15,474 | $427,326 | $98,000 | $329,326 |
| 2018 | $15,617 | $432,007 | $98,000 | $334,007 |
| 2017 | $15,285 | $430,753 | $98,000 | $332,753 |
| 2016 | $14,941 | $432,952 | $98,000 | $334,952 |
| 2015 | $14,912 | $433,946 | $98,000 | $335,946 |
| 2014 | $14,499 | $399,679 | $87,500 | $312,179 |
| 2013 | -- | $412,954 | $87,500 | $325,454 |
Source: Public Records
Map
Nearby Homes
- 20 Cal Neva Dr
- 147 Harbor Ave
- 77 Speedboat Ave
- 9820 Brockway Springs Dr
- 9702 N Lake Blvd
- 9800 Brockway Springs Dr
- 120 State Route 28 Unit 18
- 9725 Brockway Springs Dr
- 9720 Brockway Springs Dr
- 260 Northlake Cir
- 230 Park Ln
- 300 State Route 28
- 360 Wassou Rd
- 355 Tuscarora Rd
- 422 Gonowabie Rd
- 8795 Brockway Vista Ave
- 8793 Brockway Vista Ave
- 285 Gonowabie Rd Unit 18
- 460 Gonowabie Rd
- 480 Gonowabie Rd
- 30 Somers Dr
- 30 Somers Loop
- 28 Somers Dr
- 36 Somers Dr
- 34 Somers Dr
- 38 Somers Dr
- 29 Somers Dr
- 54 Somers Dr
- 40 Somers Dr Unit 9
- 42 Somers Dr
- 27 Somers Dr
- 0 Somers Loop Unit 110014357
- 0 Somers Loop Unit 130006290
- 0 Somers Loop Unit 941196
- 19 Somers Dr
- 24 Somers Dr
- 61 Somers Loop
- 51 Somers Dr
- 25 Somers Dr
- 61 Somers Loop Unit 123-201-02