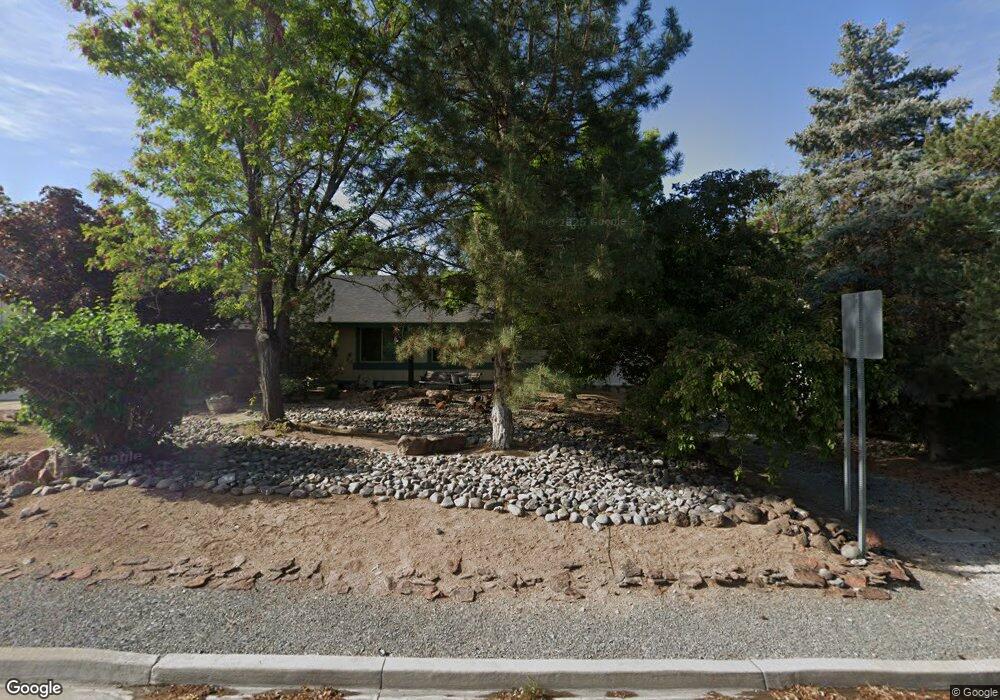
30 Starburst Cir Unit 3 Sparks, NV 89441
Sky Ranch NeighborhoodEstimated Value: $724,000 - $847,000
3
Beds
2
Baths
2,056
Sq Ft
$384/Sq Ft
Est. Value
About This Home
This home is located at 30 Starburst Cir Unit 3, Sparks, NV 89441 and is currently estimated at $789,044, approximately $383 per square foot. 30 Starburst Cir Unit 3 is a home located in Washoe County with nearby schools including Spanish Springs Elementary School, Yvonne Shaw Middle School, and Spanish Springs High School.
Ownership History
Date
Name
Owned For
Owner Type
Purchase Details
Closed on
Dec 12, 2024
Sold by
Dickinson Charles Lou and Dickinson Karen Denise
Bought by
Dickinson Family Trust and Dickinson
Current Estimated Value
Purchase Details
Closed on
Mar 18, 2021
Sold by
Dickinson Charles L
Bought by
Dickinson Charles L and Dickinson Karen D
Home Financials for this Owner
Home Financials are based on the most recent Mortgage that was taken out on this home.
Original Mortgage
$164,500
Interest Rate
3.1%
Mortgage Type
New Conventional
Purchase Details
Closed on
May 31, 2002
Sold by
Dickinson Charles L and Dickinson Karen D
Bought by
Dickinson Charles L
Home Financials for this Owner
Home Financials are based on the most recent Mortgage that was taken out on this home.
Original Mortgage
$188,500
Interest Rate
6.83%
Create a Home Valuation Report for This Property
The Home Valuation Report is an in-depth analysis detailing your home's value as well as a comparison with similar homes in the area
Home Values in the Area
Average Home Value in this Area
Purchase History
| Date | Buyer | Sale Price | Title Company |
|---|---|---|---|
| Dickinson Family Trust | -- | None Listed On Document | |
| Dickinson Family Trust | -- | None Listed On Document | |
| Dickinson Charles L | -- | Solidifi Title Agency Ltd | |
| Dickinson Charles L | $244,000 | First Centennial Title Co |
Source: Public Records
Mortgage History
| Date | Status | Borrower | Loan Amount |
|---|---|---|---|
| Previous Owner | Dickinson Charles L | $164,500 | |
| Previous Owner | Dickinson Charles L | $188,500 |
Source: Public Records
Tax History Compared to Growth
Tax History
| Year | Tax Paid | Tax Assessment Tax Assessment Total Assessment is a certain percentage of the fair market value that is determined by local assessors to be the total taxable value of land and additions on the property. | Land | Improvement |
|---|---|---|---|---|
| 2025 | $3,434 | $149,331 | $62,720 | $86,611 |
| 2024 | $3,434 | $142,479 | $54,635 | $87,844 |
| 2023 | $3,335 | $137,016 | $53,795 | $83,221 |
| 2022 | $3,238 | $118,612 | $49,525 | $69,087 |
| 2021 | $3,144 | $108,583 | $39,060 | $69,523 |
| 2020 | $3,050 | $105,030 | $35,070 | $69,960 |
| 2019 | $2,962 | $102,887 | $34,930 | $67,957 |
| 2018 | $2,875 | $90,451 | $23,660 | $66,791 |
| 2017 | $2,792 | $89,122 | $21,980 | $67,142 |
| 2016 | $2,721 | $87,802 | $19,425 | $68,377 |
| 2015 | $2,715 | $87,767 | $19,005 | $68,762 |
| 2014 | $2,636 | $83,082 | $16,310 | $66,772 |
| 2013 | -- | $78,987 | $13,125 | $65,862 |
Source: Public Records
Map
Nearby Homes
- 281 Saintsbury Ct
- 260 Virgil Dr
- 335 Cortez Ct
- 75 Mclemore Ct
- 245 Moonbeam Dr Unit 5
- 2444 Butte Creek Dr
- 2182 Butte Creek Dr
- 8044 Miramar Ct
- 2449 Butte Creek Dr
- 440 Aswan St
- 2252 Selway Dr
- 2151 Roaring Fork Ct
- 2248 Musselshell Dr
- 2144 Musselshell Ct
- 9005 Spanish Trail Dr
- 20 Carneros Dr
- 3131 Manzana Ct
- 415 Sunset Springs Ln
- 3110 Rama Ct
- 8080 Tres Arroyos Ct
- 40 Starburst Cir
- 20 Starburst Cir
- 35 Starburst Cir
- 15 Starburst Cir
- 45 Starburst Cir
- 50 Starburst Cir
- 385 Omni Dr
- 60 Starburst Ct
- 382 Omni Dr
- 80 Starburst Ct Unit 3
- 70 Starburst Ct
- 90 Starburst Cir
- 386 Omni Dr Unit 1
- 25 Bridle Path Terrace
- 388 Omni Dr
- 105 Starburst Cir
- 205 E Sky Ranch Blvd
- 175 E Sky Ranch Blvd
- 100 Starburst Cir
- 185 E Sky Ranch Blvd