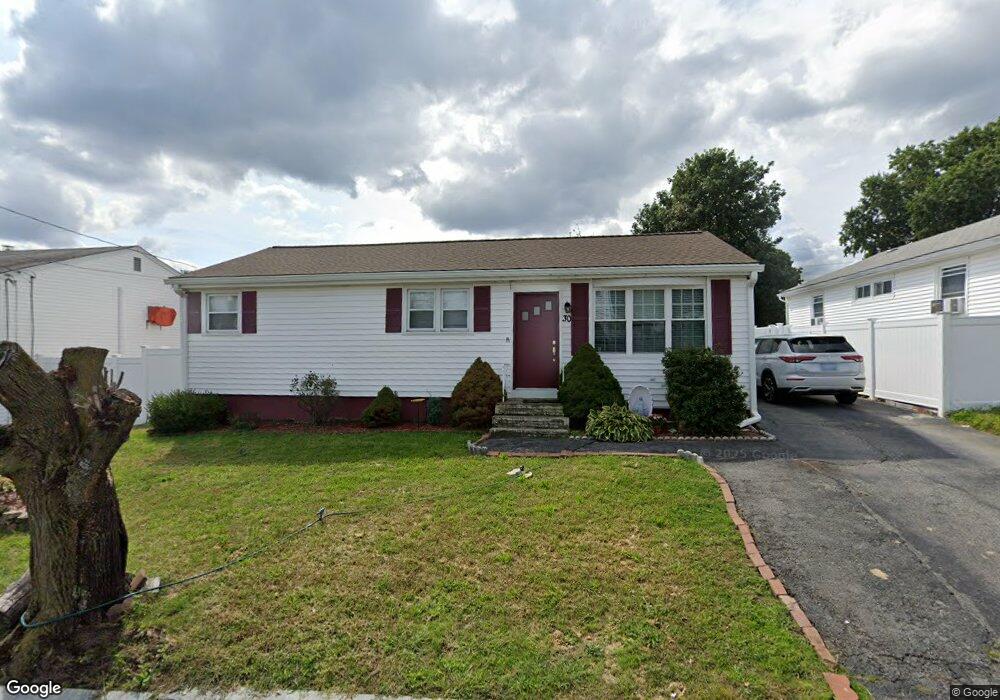
30 Swift St Providence, RI 02904
Charles NeighborhoodEstimated Value: $384,518 - $396,000
3
Beds
2
Baths
1,008
Sq Ft
$388/Sq Ft
Est. Value
About This Home
This home is located at 30 Swift St, Providence, RI 02904 and is currently estimated at $390,630, approximately $387 per square foot. 30 Swift St is a home located in Providence County with nearby schools including Times Squared Academy, Times2 Elementary School, and Times2 Middle/High School.
Ownership History
Date
Name
Owned For
Owner Type
Purchase Details
Closed on
Oct 31, 2000
Sold by
Corzo Angelo M and Corzo Milton E
Bought by
Salazar Javier A
Current Estimated Value
Purchase Details
Closed on
Dec 23, 1993
Sold by
Cabral Rosemarie and Cabral Joseph
Bought by
Derobbio Angela M and Corzo Milton E
Create a Home Valuation Report for This Property
The Home Valuation Report is an in-depth analysis detailing your home's value as well as a comparison with similar homes in the area
Home Values in the Area
Average Home Value in this Area
Purchase History
| Date | Buyer | Sale Price | Title Company |
|---|---|---|---|
| Salazar Javier A | $105,000 | -- | |
| Derobbio Angela M | $90,000 | -- |
Source: Public Records
Mortgage History
| Date | Status | Borrower | Loan Amount |
|---|---|---|---|
| Open | Derobbio Angela M | $192,800 | |
| Closed | Derobbio Angela M | $48,200 | |
| Closed | Derobbio Angela M | $160,000 |
Source: Public Records
Tax History
| Year | Tax Paid | Tax Assessment Tax Assessment Total Assessment is a certain percentage of the fair market value that is determined by local assessors to be the total taxable value of land and additions on the property. | Land | Improvement |
|---|---|---|---|---|
| 2025 | $2,995 | $356,600 | $129,300 | $227,300 |
| 2024 | $5,158 | $281,100 | $84,800 | $196,300 |
| 2023 | $5,158 | $281,100 | $84,800 | $196,300 |
| 2022 | $5,004 | $281,100 | $84,800 | $196,300 |
| 2021 | $4,708 | $191,700 | $63,700 | $128,000 |
| 2020 | $4,708 | $191,700 | $63,700 | $128,000 |
| 2019 | $4,490 | $182,800 | $63,700 | $119,100 |
| 2018 | $4,037 | $126,300 | $49,200 | $77,100 |
| 2017 | $4,037 | $126,300 | $49,200 | $77,100 |
| 2016 | $4,037 | $126,300 | $49,200 | $77,100 |
| 2015 | $3,704 | $111,900 | $49,800 | $62,100 |
| 2014 | $3,777 | $111,900 | $49,800 | $62,100 |
| 2013 | $3,777 | $111,900 | $49,800 | $62,100 |
Source: Public Records
Map
Nearby Homes
Your Personal Tour Guide
Ask me questions while you tour the home.