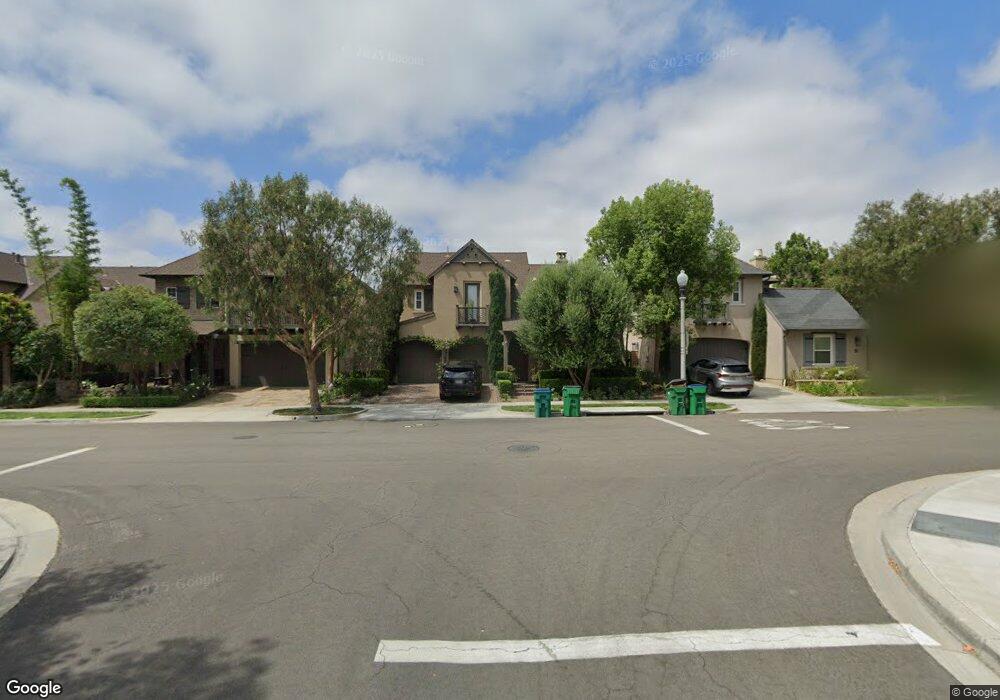
30 Townsend Irvine, CA 92620
Woodbury and Stonegate NeighborhoodEstimated Value: $2,700,000 - $3,003,000
4
Beds
4
Baths
3,418
Sq Ft
$829/Sq Ft
Est. Value
About This Home
This home is located at 30 Townsend, Irvine, CA 92620 and is currently estimated at $2,834,648, approximately $829 per square foot. 30 Townsend is a home located in Orange County with nearby schools including Jeffrey Trail Middle, Portola High School, and New Horizon Elementary School.
Ownership History
Date
Name
Owned For
Owner Type
Purchase Details
Closed on
May 31, 2013
Sold by
Brune Christopher and Brune Dawn
Bought by
Brune Christopher and Brune Dawn
Current Estimated Value
Home Financials for this Owner
Home Financials are based on the most recent Mortgage that was taken out on this home.
Original Mortgage
$776,000
Outstanding Balance
$547,801
Interest Rate
3.32%
Mortgage Type
New Conventional
Estimated Equity
$2,286,847
Purchase Details
Closed on
Sep 2, 2010
Sold by
Brune Chris and Brune Dawn
Bought by
Brune Christopher and Brune Dawn
Purchase Details
Closed on
Mar 12, 2008
Sold by
Standard Pacific Corp
Bought by
Brune Chris and Brune Dawn
Home Financials for this Owner
Home Financials are based on the most recent Mortgage that was taken out on this home.
Original Mortgage
$1,000,000
Interest Rate
5.5%
Mortgage Type
Purchase Money Mortgage
Create a Home Valuation Report for This Property
The Home Valuation Report is an in-depth analysis detailing your home's value as well as a comparison with similar homes in the area
Home Values in the Area
Average Home Value in this Area
Purchase History
| Date | Buyer | Sale Price | Title Company |
|---|---|---|---|
| Brune Christopher | -- | First American Title Ins Co | |
| Brune Christopher | -- | First American Title Ins Co | |
| Brune Christopher | -- | None Available | |
| Brune Chris | $1,332,000 | First American Title |
Source: Public Records
Mortgage History
| Date | Status | Borrower | Loan Amount |
|---|---|---|---|
| Open | Brune Christopher | $776,000 | |
| Closed | Brune Chris | $1,000,000 |
Source: Public Records
Tax History
| Year | Tax Paid | Tax Assessment Tax Assessment Total Assessment is a certain percentage of the fair market value that is determined by local assessors to be the total taxable value of land and additions on the property. | Land | Improvement |
|---|---|---|---|---|
| 2025 | $22,267 | $1,758,963 | $876,314 | $882,649 |
| 2024 | $22,267 | $1,724,474 | $859,131 | $865,343 |
| 2023 | $21,807 | $1,690,661 | $842,285 | $848,376 |
| 2022 | $21,335 | $1,648,691 | $825,769 | $822,922 |
| 2021 | $20,970 | $1,616,364 | $809,577 | $806,787 |
| 2020 | $20,707 | $1,599,791 | $801,276 | $798,515 |
| 2019 | $21,048 | $1,568,423 | $785,565 | $782,858 |
| 2018 | $20,698 | $1,537,670 | $770,162 | $767,508 |
| 2017 | $20,390 | $1,507,520 | $755,061 | $752,459 |
| 2016 | $20,292 | $1,477,961 | $740,256 | $737,705 |
| 2015 | $20,026 | $1,455,761 | $729,137 | $726,624 |
| 2014 | $18,064 | $1,264,200 | $599,348 | $664,852 |
Source: Public Records
Map
Nearby Homes
- 42 Vintage Unit 102
- 123 Chantilly Unit 100
- 50 Vintage
- 5200 Irvine Blvd Unit 497
- 5200 Irvine Blvd
- 5200 Irvine Blvd Unit 123
- 5200 Irvine Blvd Unit 256
- 5200 Irvine Blvd Unit 254
- 5200 Irvine Blvd Unit 360
- 5200 Irvine Blvd Unit 156
- 5200 Irvine Blvd Unit 183
- 5200 Irvine Blvd Unit 54
- 120 Gemstone
- 109 Sugar Cane
- 21 Fanpalm
- 192 Wild Lilac
- 94 Mission
- 181 Groveland
- 131 Damsel
- 8 Monticello
Your Personal Tour Guide
Ask me questions while you tour the home.