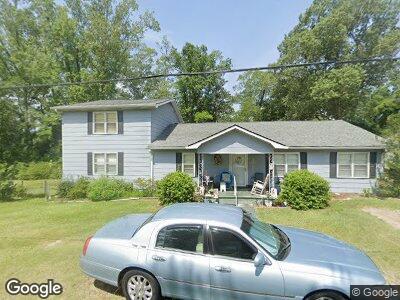
30 Turner St Unit 307 Hawkinsville, GA 31036
Estimated Value: $136,000 - $187,481
3
Beds
2
Baths
2,720
Sq Ft
$60/Sq Ft
Est. Value
About This Home
This home is located at 30 Turner St Unit 307, Hawkinsville, GA 31036 and is currently estimated at $163,120, approximately $59 per square foot. 30 Turner St Unit 307 is a home located in Pulaski County with nearby schools including Pulaski County Elementary School, Pulaski County Middle School, and Hawkinsville High School.
Ownership History
Date
Name
Owned For
Owner Type
Purchase Details
Closed on
Jul 18, 2022
Sold by
Mckinley Emory A
Bought by
Williams Sheri Ann
Current Estimated Value
Purchase Details
Closed on
May 26, 2006
Sold by
Wells Fargo Bank Na Trustee
Bought by
Mckinley Emory A
Home Financials for this Owner
Home Financials are based on the most recent Mortgage that was taken out on this home.
Original Mortgage
$70,000
Interest Rate
9%
Mortgage Type
New Conventional
Purchase Details
Closed on
Dec 6, 2005
Sold by
Lumpkin Albert
Bought by
Wells Fargo Bank Na Trustee
Purchase Details
Closed on
Apr 6, 2005
Sold by
Mckinley Curtis E
Bought by
Lumpkin Albert
Home Financials for this Owner
Home Financials are based on the most recent Mortgage that was taken out on this home.
Original Mortgage
$78,300
Interest Rate
8.38%
Mortgage Type
New Conventional
Purchase Details
Closed on
Jun 25, 1997
Sold by
Mckinley Emory
Bought by
Mckinley Curtis E
Create a Home Valuation Report for This Property
The Home Valuation Report is an in-depth analysis detailing your home's value as well as a comparison with similar homes in the area
Home Values in the Area
Average Home Value in this Area
Purchase History
| Date | Buyer | Sale Price | Title Company |
|---|---|---|---|
| Williams Sheri Ann | -- | -- | |
| Mckinley Emory A | $70,000 | -- | |
| Wells Fargo Bank Na Trustee | -- | -- | |
| Lumpkin Albert | $87,000 | -- | |
| Mckinley Curtis E | $72,000 | -- |
Source: Public Records
Mortgage History
| Date | Status | Borrower | Loan Amount |
|---|---|---|---|
| Previous Owner | Mckinley Emory A | $73,500 | |
| Previous Owner | Mckinley Emory A | $70,000 | |
| Previous Owner | Lumpkin Albert | $78,300 |
Source: Public Records
Tax History Compared to Growth
Tax History
| Year | Tax Paid | Tax Assessment Tax Assessment Total Assessment is a certain percentage of the fair market value that is determined by local assessors to be the total taxable value of land and additions on the property. | Land | Improvement |
|---|---|---|---|---|
| 2024 | $2,109 | $79,724 | $2,160 | $77,564 |
| 2023 | $2,109 | $27,454 | $1,419 | $26,035 |
| 2022 | $862 | $27,454 | $1,419 | $26,035 |
| 2021 | $865 | $27,454 | $1,419 | $26,035 |
| 2020 | $868 | $27,454 | $1,419 | $26,035 |
| 2019 | $866 | $27,454 | $1,419 | $26,035 |
| 2018 | $923 | $27,454 | $1,419 | $26,035 |
| 2017 | $790 | $27,454 | $1,419 | $26,035 |
| 2016 | $867 | $27,454 | $1,419 | $26,035 |
| 2015 | -- | $27,454 | $1,419 | $26,035 |
| 2014 | -- | $27,454 | $1,419 | $26,035 |
| 2013 | -- | $27,453 | $1,418 | $26,034 |
Source: Public Records
Map
Nearby Homes
- 30 Turner St Unit 307
- 26 Turner St
- 26 Turner St Unit 203
- 34 Turner St
- 0 Turner St Unit 7265246
- 0 Turner St Unit 8075098
- 0 Turner St Unit 8277859
- 0 Turner St Unit 7097417
- 0 Turner St
- 102 W Mcduffie St Unit 801
- 102 Mcduffie St
- 102 W Mcduffie St
- 102 Mc Duffie St
- 102 W McDuffie #801 St W
- 33 Turner St
- 29 Turner St
- 25 Turner St Unit 302
- 3 Brookside Dr
- 39 Turner St Unit 400
- 21 Turner St Unit 300