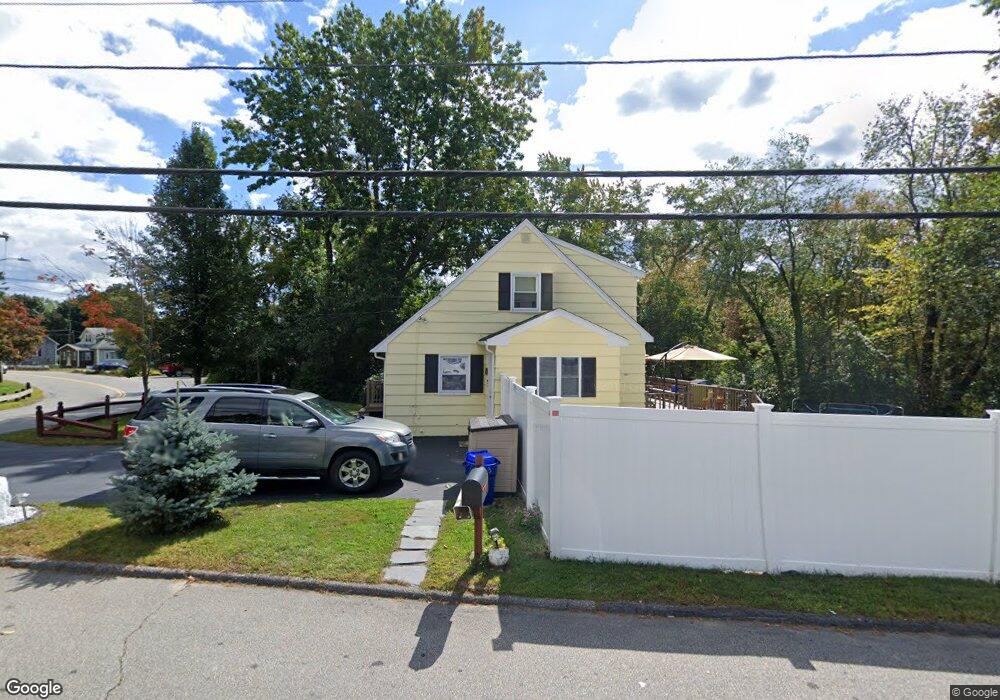
30 Tyler St Methuen, MA 01844
The West End NeighborhoodEstimated Value: $610,000 - $726,000
4
Beds
2
Baths
2,756
Sq Ft
$238/Sq Ft
Est. Value
About This Home
This home is located at 30 Tyler St, Methuen, MA 01844 and is currently estimated at $656,917, approximately $238 per square foot. 30 Tyler St is a home located in Essex County with nearby schools including Marsh Grammar School, Methuen High School, and The Islamic Academy For Peace.
Ownership History
Date
Name
Owned For
Owner Type
Purchase Details
Closed on
May 30, 2003
Sold by
Frechette Mary Ann
Bought by
Federico Danielle Rose and Federico Frank J
Current Estimated Value
Home Financials for this Owner
Home Financials are based on the most recent Mortgage that was taken out on this home.
Original Mortgage
$220,000
Interest Rate
5.86%
Mortgage Type
Purchase Money Mortgage
Purchase Details
Closed on
Aug 14, 1992
Sold by
Maines Almon F
Bought by
Frechette Mary Ann
Create a Home Valuation Report for This Property
The Home Valuation Report is an in-depth analysis detailing your home's value as well as a comparison with similar homes in the area
Home Values in the Area
Average Home Value in this Area
Purchase History
| Date | Buyer | Sale Price | Title Company |
|---|---|---|---|
| Federico Danielle Rose | $275,000 | -- | |
| Federico Danielle Rose | $275,000 | -- | |
| Frechette Mary Ann | $120,700 | -- | |
| Frechette Mary Ann | $120,700 | -- |
Source: Public Records
Mortgage History
| Date | Status | Borrower | Loan Amount |
|---|---|---|---|
| Open | Frechette Mary Ann | $223,000 | |
| Closed | Federico Danielle Rose | $220,000 |
Source: Public Records
Tax History
| Year | Tax Paid | Tax Assessment Tax Assessment Total Assessment is a certain percentage of the fair market value that is determined by local assessors to be the total taxable value of land and additions on the property. | Land | Improvement |
|---|---|---|---|---|
| 2025 | $5,575 | $526,900 | $251,900 | $275,000 |
| 2024 | $5,475 | $504,100 | $229,000 | $275,100 |
| 2023 | $5,133 | $438,700 | $204,500 | $234,200 |
| 2022 | $4,522 | $346,500 | $163,600 | $182,900 |
| 2021 | $4,301 | $326,100 | $155,400 | $170,700 |
| 2020 | $4,317 | $321,200 | $155,400 | $165,800 |
| 2019 | $4,204 | $296,300 | $147,200 | $149,100 |
| 2018 | $4,128 | $289,300 | $147,200 | $142,100 |
| 2017 | $4,007 | $273,500 | $147,200 | $126,300 |
| 2016 | $3,870 | $261,300 | $147,200 | $114,100 |
| 2015 | $3,726 | $255,200 | $147,200 | $108,000 |
Source: Public Records
Map
Nearby Homes
- 16 Marjorie St
- 263 Forest St
- 18 Stone Castle Dr Unit 76
- 50 Arrowwood St
- 26 Hobson St
- 290 Salem Rd
- 298 Salem Rd
- 302 Salem Rd
- 37 Lexington Ave
- 945 Riverside Dr Unit 5B
- 235 Oakland Ave
- 17 Horseshoe Rd
- 219 Pelham St
- 22 Elm St
- 46 Hopkins Cir
- 7 Field Ave
- 34 Venice Rd
- 35 Canobieola Rd
- 2 Deerberry Ln
- 344B Hampshire Rd
Your Personal Tour Guide
Ask me questions while you tour the home.